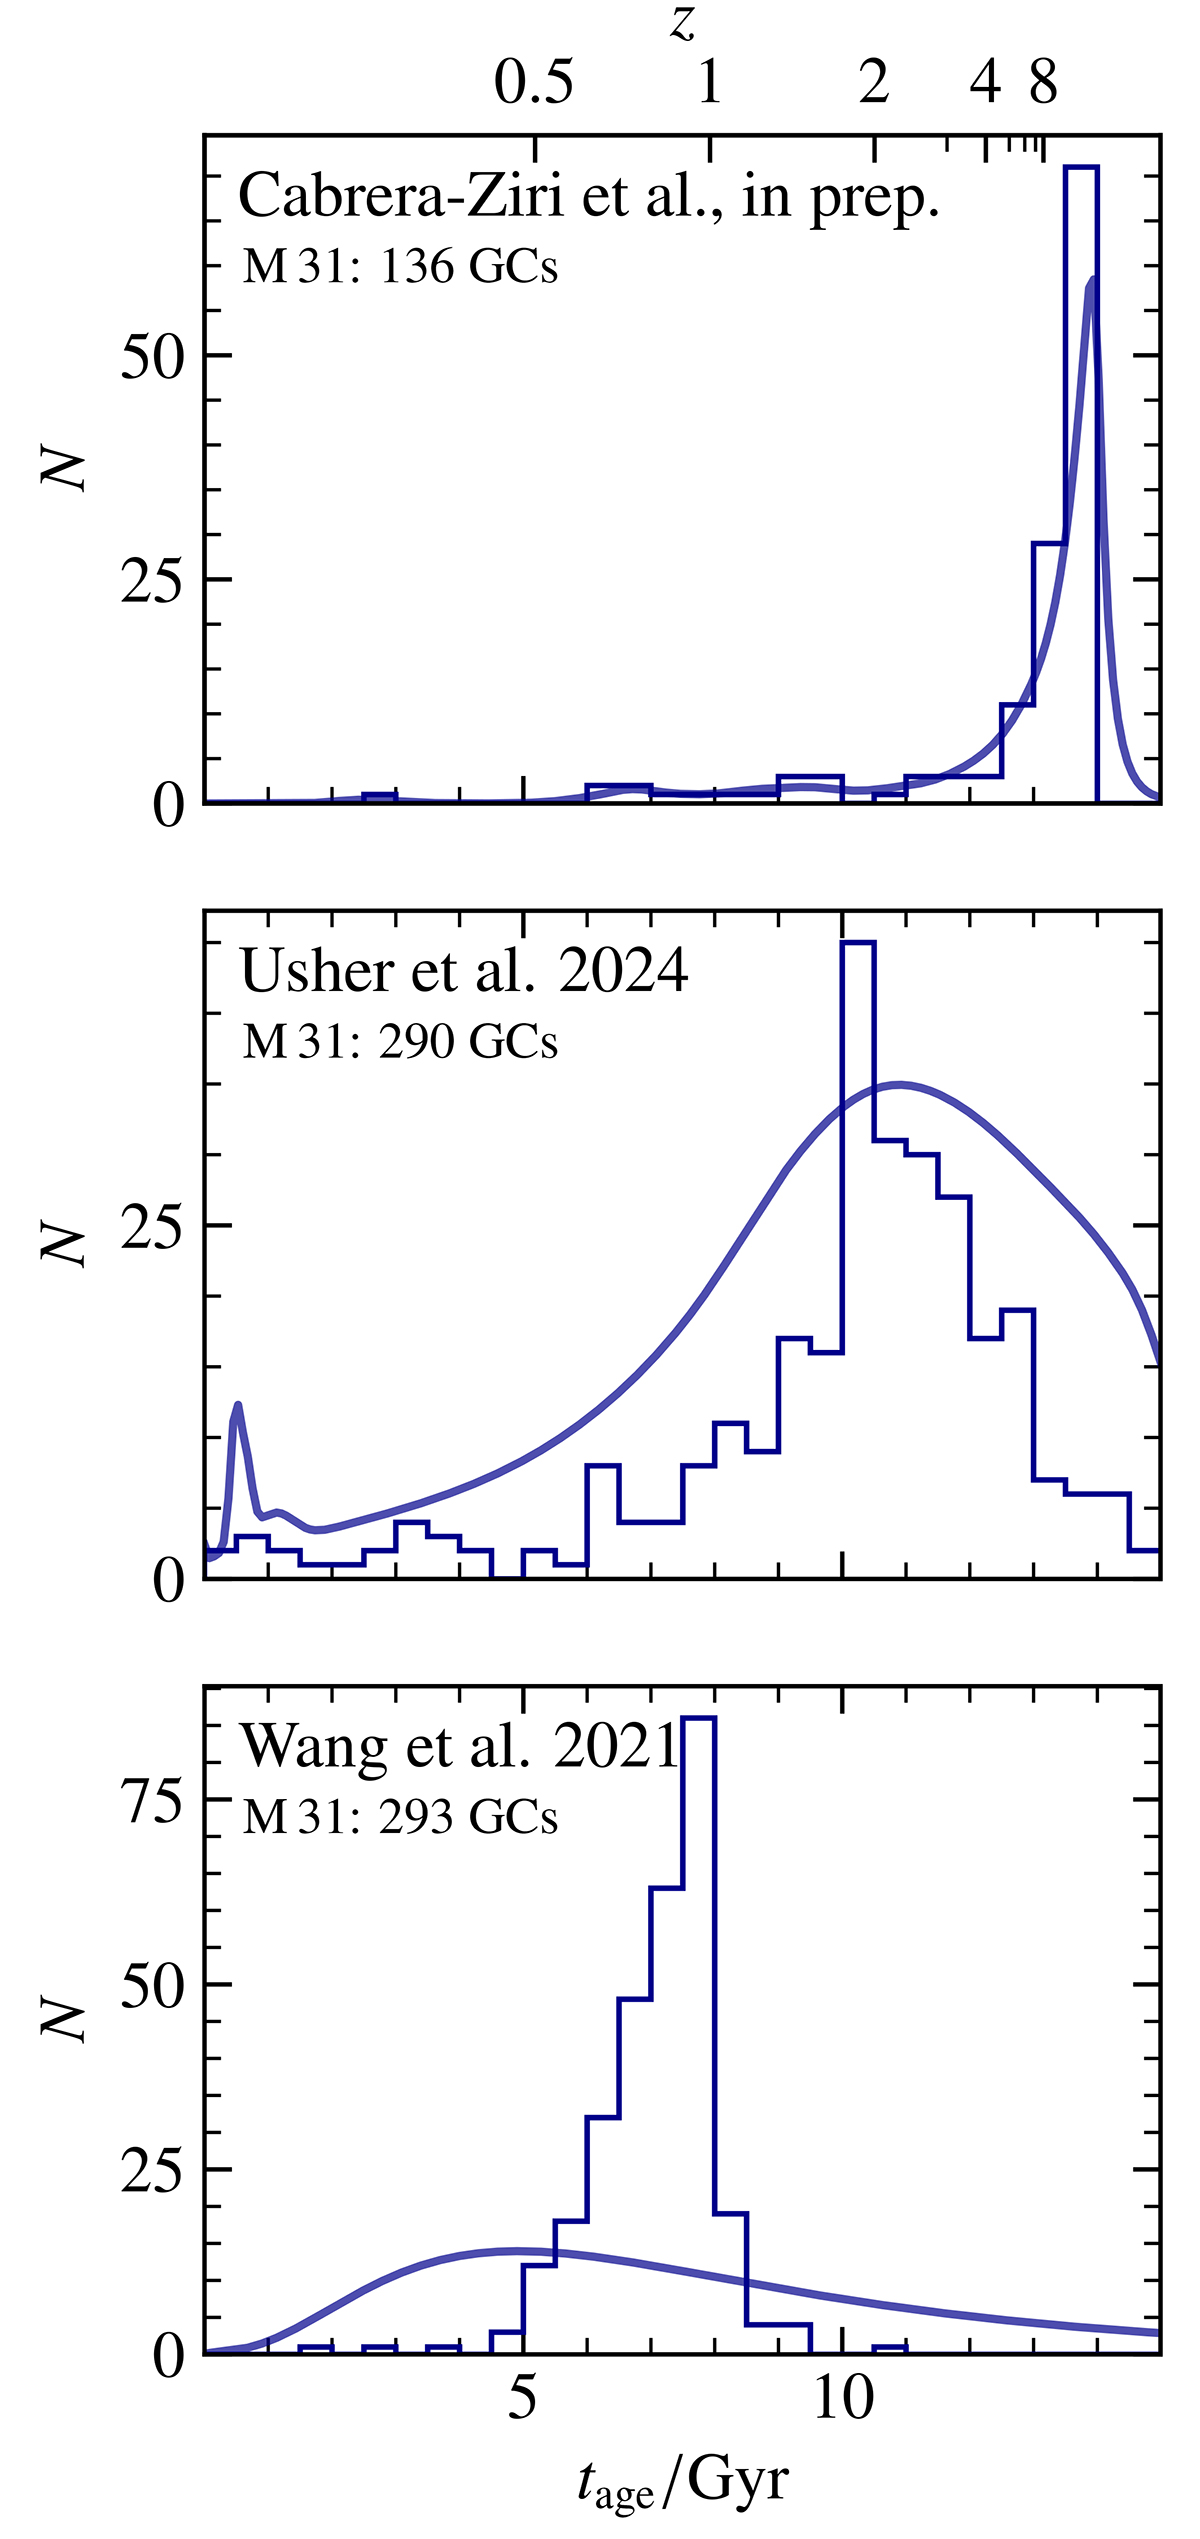
Fig. 5.
Download original image
Globular cluster age distribution in M 31 from Cabrera-Ziri et al. (in prep.), Usher et al. (2024), and Wang et al. (2021), with sample sizes of 136 GCs, 290 GCs, and 293 GCs, respectively. The ages in the sample of Wang et al. (2021) correspond to their determined old clusters (tage > 1.5 Gyr). For further comparisons with previous GC age determinations in M 31, see Fig. 8 of Wang et al. (2021). The smooth lines show the distributions smoothed by the measurement uncertainties. These are computed through a summation over normal distributions with the respective ages as the means and their uncertainties as the standard deviations for Usher et al. (2024) and over log-normal distributions for the other two data sets. Note that for the logarithmic uncertainties, the visualization in linear space is skewed with respect to the peak.
Current usage metrics show cumulative count of Article Views (full-text article views including HTML views, PDF and ePub downloads, according to the available data) and Abstracts Views on Vision4Press platform.
Data correspond to usage on the plateform after 2015. The current usage metrics is available 48-96 hours after online publication and is updated daily on week days.
Initial download of the metrics may take a while.