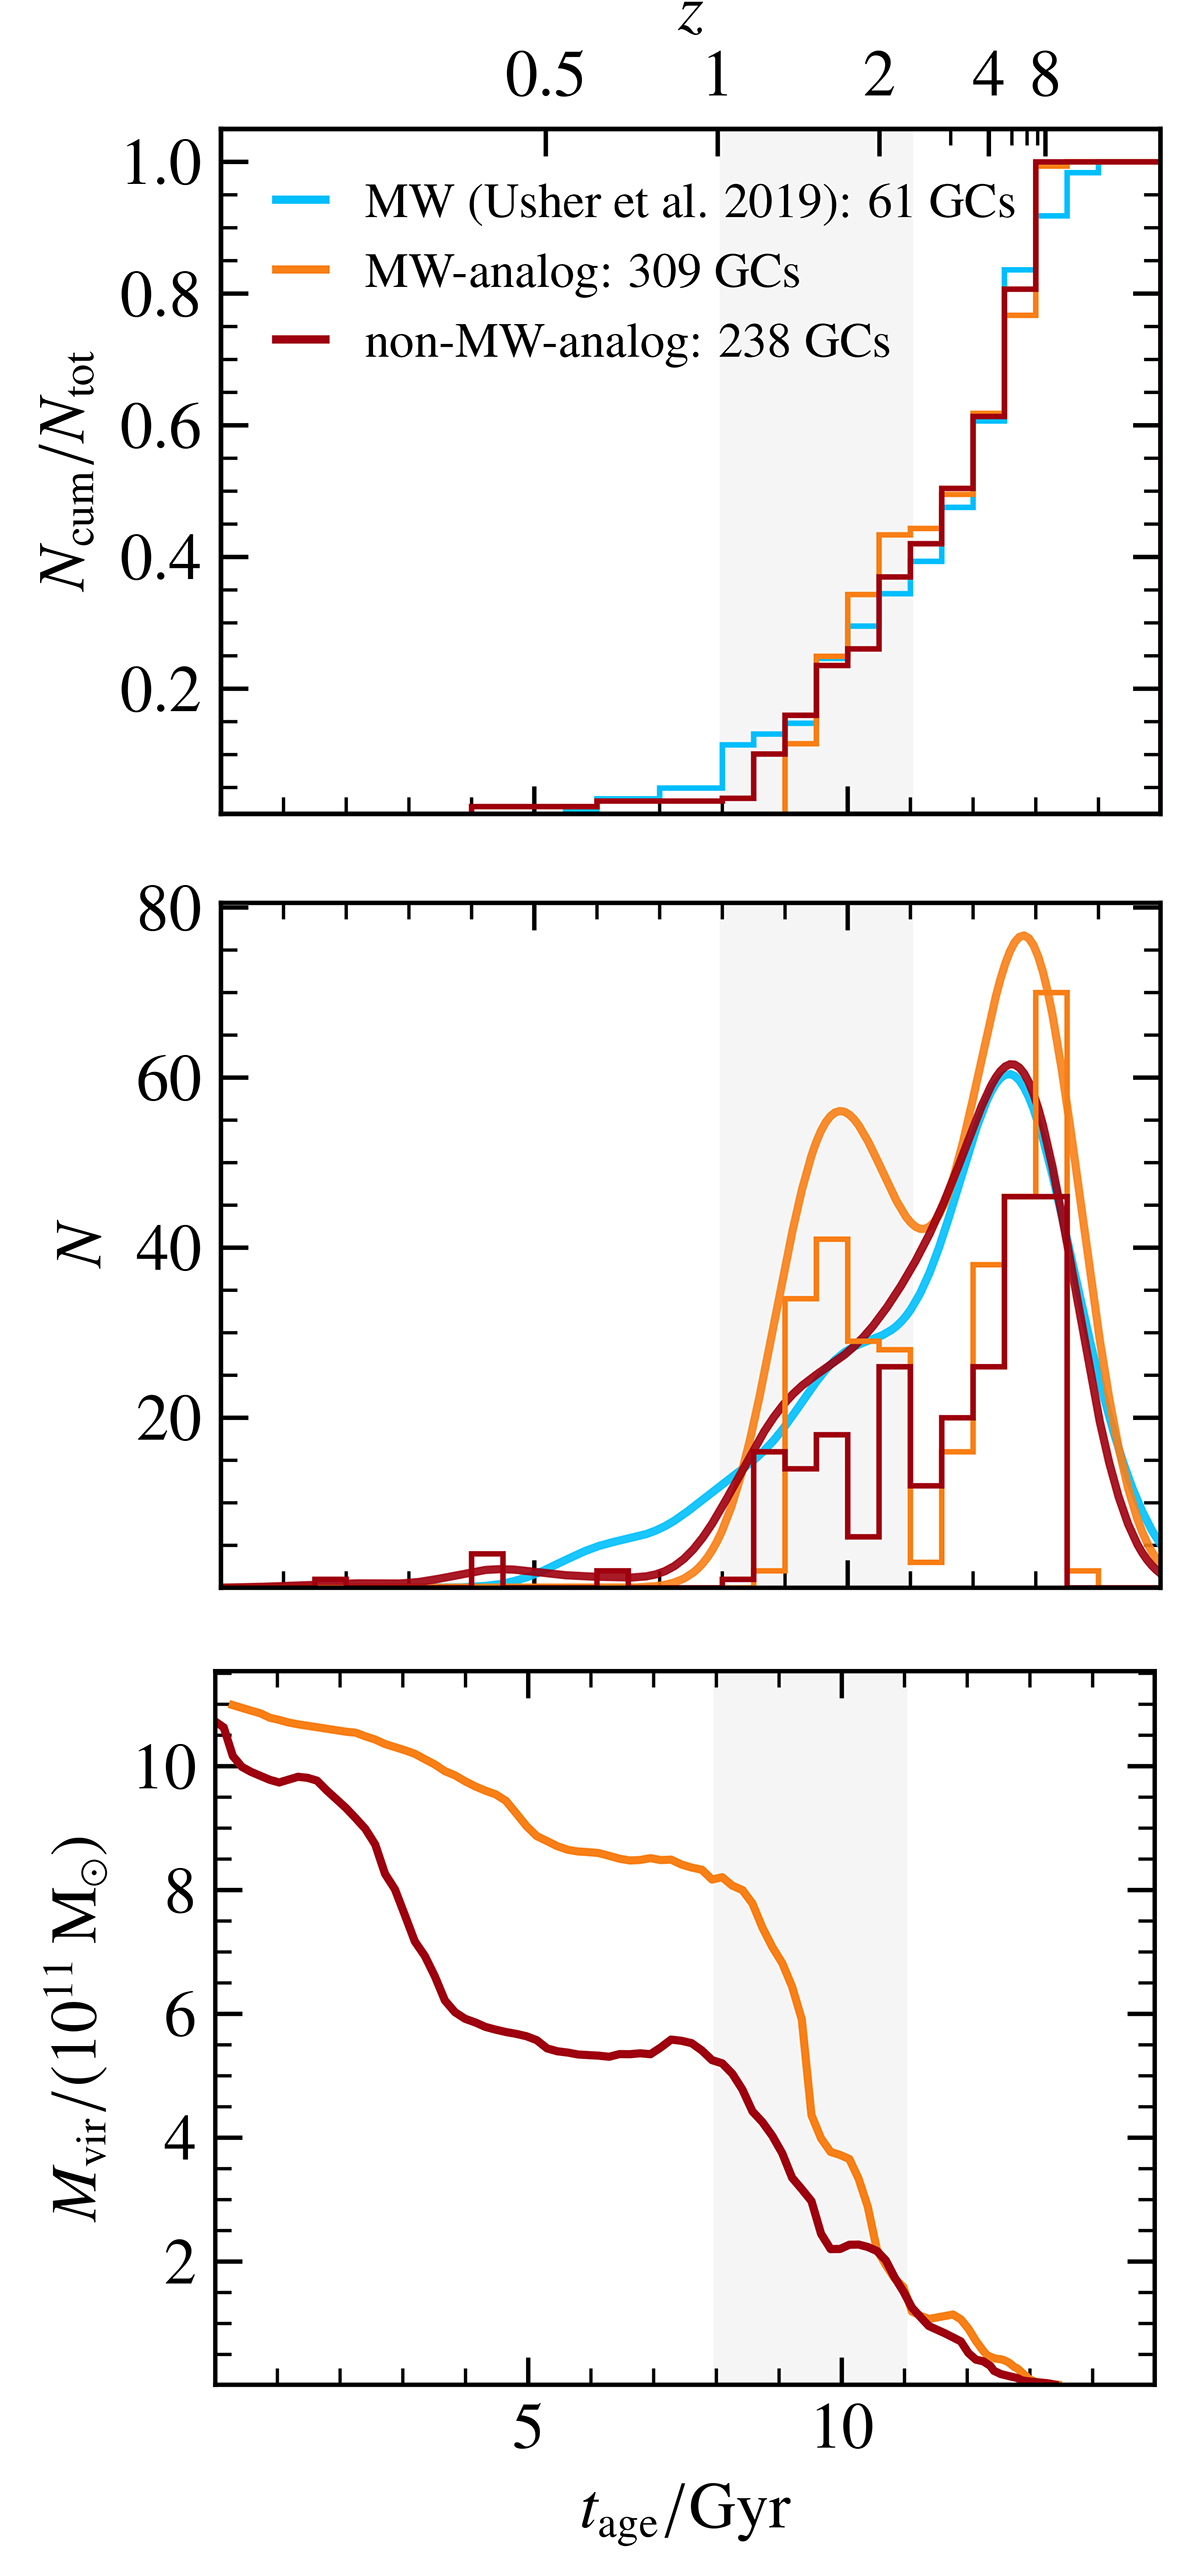
Fig. 2.
Download original image
GC ages and virial mass evolutions of two selected modeled MW-mass galaxies compared to the observed GC ages in the MW. Top: cumulative GC age distributions of the MW from Usher et al. (2019) (blue) and of two modeled GC populations in simulated MW-mass galaxies from Valenzuela et al. (2021) (red and orange). Middle: age distributions of the same three GC populations as in the top panel. The smooth distributions are smoothed using an assumed uncertainty of 0.75 Gyr for the GC ages. These are computed through a summation over normal distributions with the respective ages as the means and their uncertainties as the standard deviations. For the sample from Usher et al. (2019), the distribution was scaled by a factor of four to be comparable to the modeled populations. Bottom: dark matter virial mass evolution of the two modeled galaxies, showing their accretion histories. The shaded region between 8 Gyr and 11 Gyr indicates the estimated time of the GSE merger (Belokurov et al. 2018; Helmi et al. 2018).
Current usage metrics show cumulative count of Article Views (full-text article views including HTML views, PDF and ePub downloads, according to the available data) and Abstracts Views on Vision4Press platform.
Data correspond to usage on the plateform after 2015. The current usage metrics is available 48-96 hours after online publication and is updated daily on week days.
Initial download of the metrics may take a while.