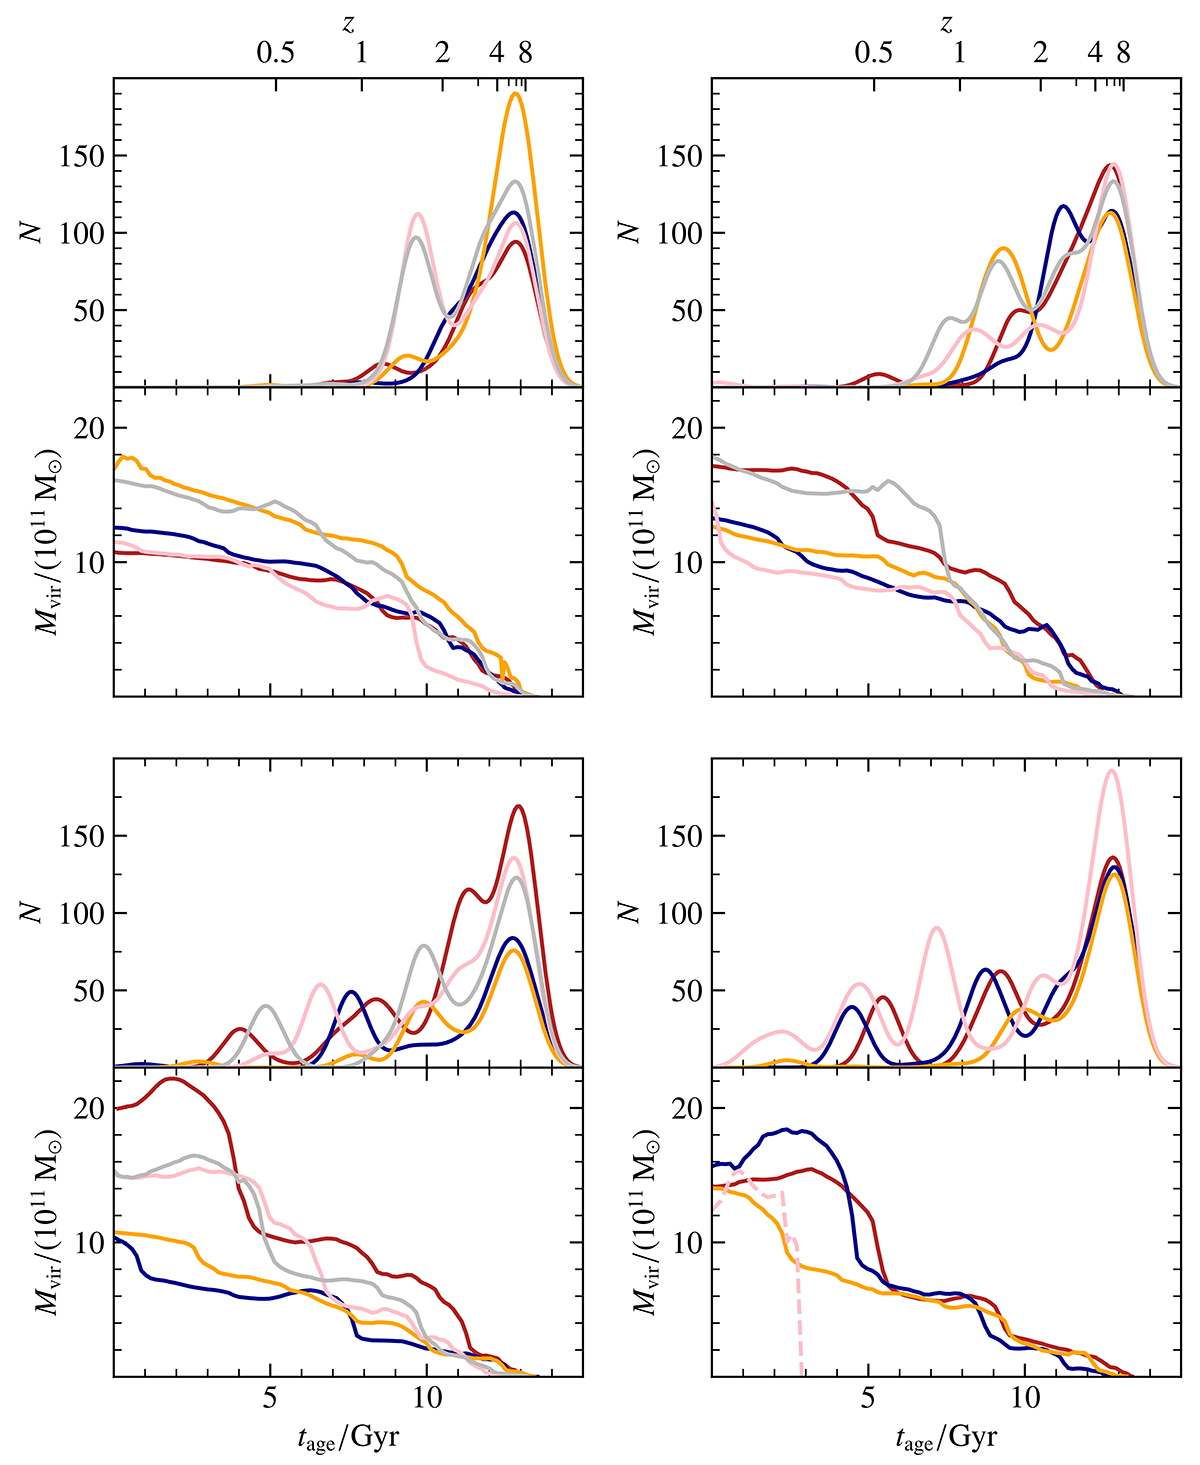
Fig. B.1.

Download original image
Age distributions of the globular clusters in 19 simulated MW-mass galaxies and their virial mass evolutions plotted below the respective age distributions in the same colors for each galaxy. The distributions are smoothed using an assumed uncertainty of 0.5 Gyr for the GC ages. The galaxies shown in the top left panels are the galaxies that reached half of their z = 0 virial mass at the earliest time, followed by the galaxies in the top right panel. The galaxies in the bottom right panel are those that reach half of the current virial mass the latest. The galaxy with the dashed virial mass evolution line has an issue with the merger tree, but the GC population is correct.
Current usage metrics show cumulative count of Article Views (full-text article views including HTML views, PDF and ePub downloads, according to the available data) and Abstracts Views on Vision4Press platform.
Data correspond to usage on the plateform after 2015. The current usage metrics is available 48-96 hours after online publication and is updated daily on week days.
Initial download of the metrics may take a while.


