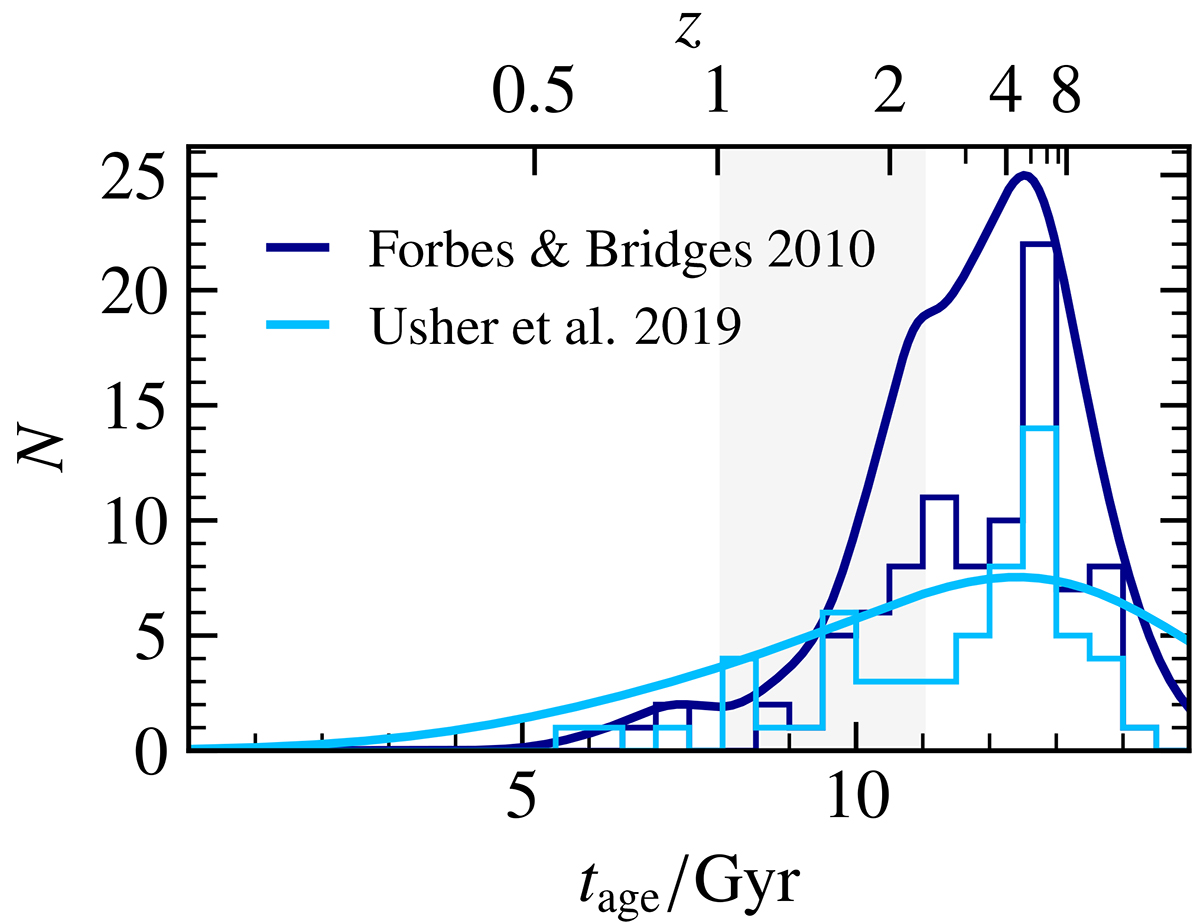
Fig. 1.
Download original image
Globular cluster age distributions in the MW from Forbes & Bridges (2010) and Usher et al. (2019), with sample sizes of 92 and 61 GCs, respectively. The boxy lines are the actual histograms, while the smooth curves show the distributions smoothed by the measurement uncertainties. These are computed through a summation over normal distributions with the respective ages as the means and their uncertainties as the standard deviations. The shaded region between 8 Gyr and 11 Gyr indicates the estimated time of the GSE merger (Belokurov et al. 2018; Helmi et al. 2018).
Current usage metrics show cumulative count of Article Views (full-text article views including HTML views, PDF and ePub downloads, according to the available data) and Abstracts Views on Vision4Press platform.
Data correspond to usage on the plateform after 2015. The current usage metrics is available 48-96 hours after online publication and is updated daily on week days.
Initial download of the metrics may take a while.