Fig. 9.
Download original image
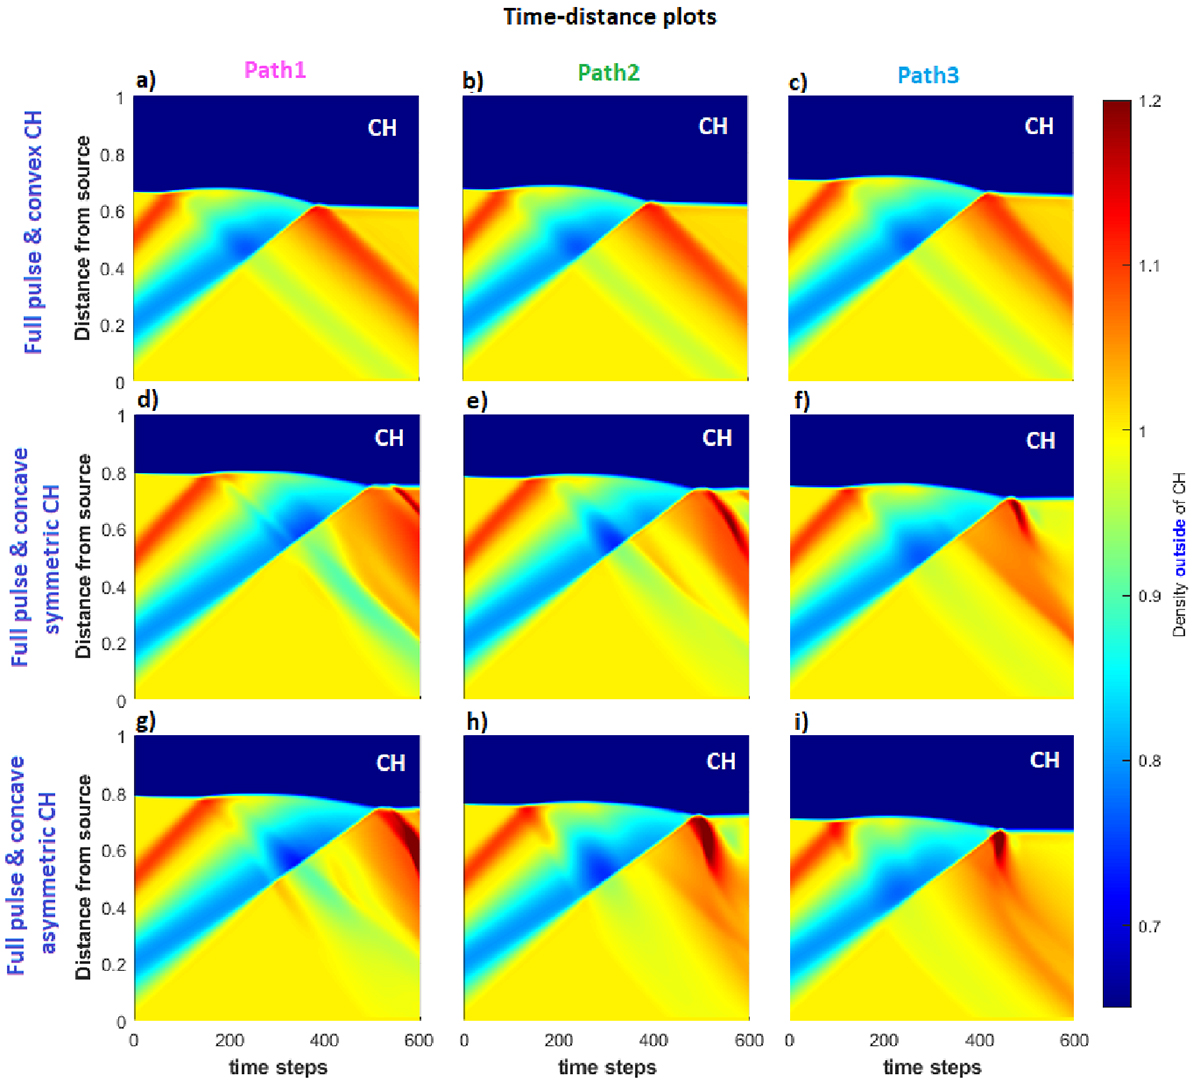
Time-distance plots along Path1 (magenta), Path2 (green), and Path3 (blue) for different density profiles of the incoming wave and different CH geometries. The blue and green regions denote areas in which the density is lower than the background density (depletion), and the red and orange regions denote areas in which the density is higher than the background density (enhancement). The horizontal dark blue regions denote the CH area. All incoming waves consist of an enhancement at the wave front and a depletion area in the rear part of the wave. The CH density for all cases is ρCH = 0.1. (a)–(c): Interaction with a convex CH. (d)–(f): Interaction with a concave symmetric CH. (g)–(i): Interaction with a concave asymmetric CH.
Current usage metrics show cumulative count of Article Views (full-text article views including HTML views, PDF and ePub downloads, according to the available data) and Abstracts Views on Vision4Press platform.
Data correspond to usage on the plateform after 2015. The current usage metrics is available 48-96 hours after online publication and is updated daily on week days.
Initial download of the metrics may take a while.