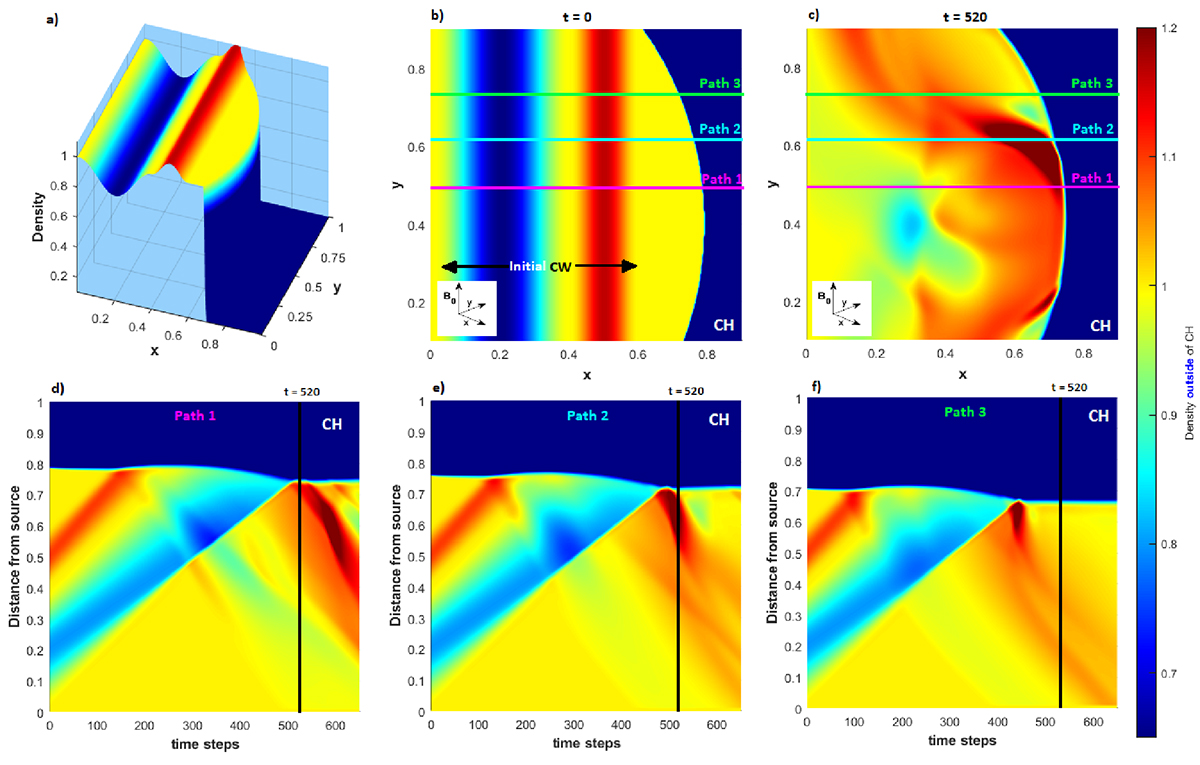
Fig. 7.
Download original image
Density structure of a CW that interacts with a concave CH and the corresponding time-distance plots based on three different paths. (a) 3D visualisation of the initial conditions of a straight incoming wave (including a density enhancement, red, and a depleted wave part, blue) that interacts with an asymmetric low-density concave area that denotes the CH. (b) 2D initial conditions at t = 0, as in plot a. The magenta, turquoise, and green lines denote the paths along which the different time-distance plots are generated. (c) Density distribution at the end of the temporal evolution (t = 650) of the CW–CH interaction, together with the three paths along which the time-distance plots are created. (d)–(f) Time-distance plots showing the temporal evolution of the incoming and reflected wave along Path 1 (magenta), Path 2 (turquoise), and Path 3 (green). The blue and green areas denote regions in which the density is lower than the background density, and the red and orange areas denote regions in which the density is higher than the background density.
Current usage metrics show cumulative count of Article Views (full-text article views including HTML views, PDF and ePub downloads, according to the available data) and Abstracts Views on Vision4Press platform.
Data correspond to usage on the plateform after 2015. The current usage metrics is available 48-96 hours after online publication and is updated daily on week days.
Initial download of the metrics may take a while.