Fig. 5.
Download original image
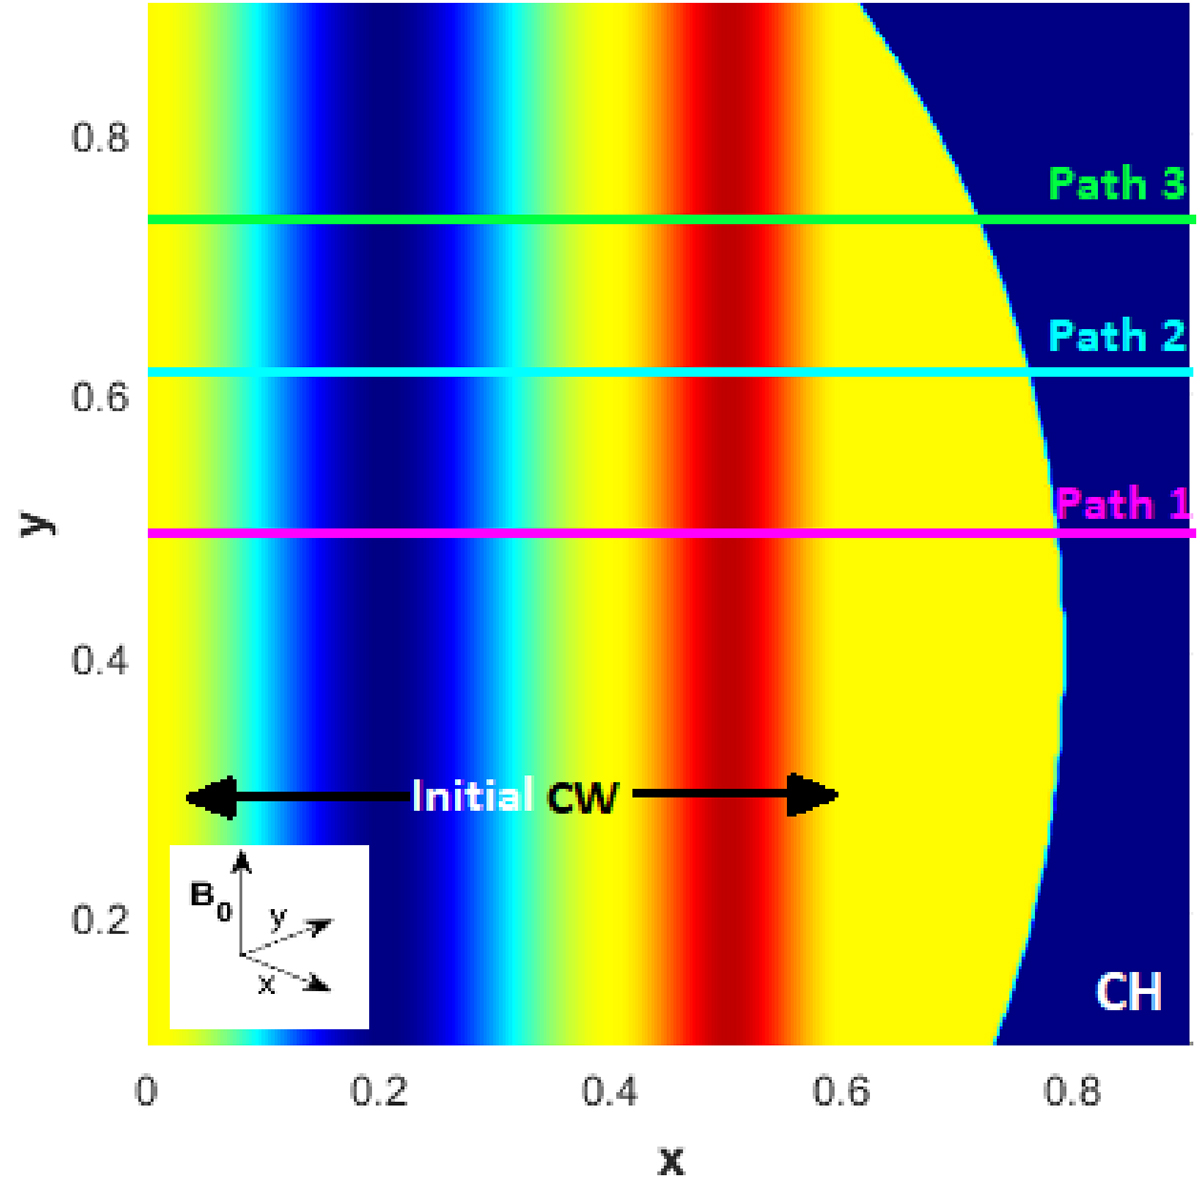
Three different paths (Path1, Path2, and Path3) along which the time-distance plots were generated. The vertical dark blue structure at the left denotes the depleted part of the initial incoming wave, and the vertical red structure represents the enhanced part of the incoming wave (details of the amplitudes are shown in Fig. 1). The CH exhibits an asymmetric concave density structure and has a CH density of ρCH = 0.1. The background magnetic field is homogeneous and always points in the z-direction in this 2D setup.
Current usage metrics show cumulative count of Article Views (full-text article views including HTML views, PDF and ePub downloads, according to the available data) and Abstracts Views on Vision4Press platform.
Data correspond to usage on the plateform after 2015. The current usage metrics is available 48-96 hours after online publication and is updated daily on week days.
Initial download of the metrics may take a while.