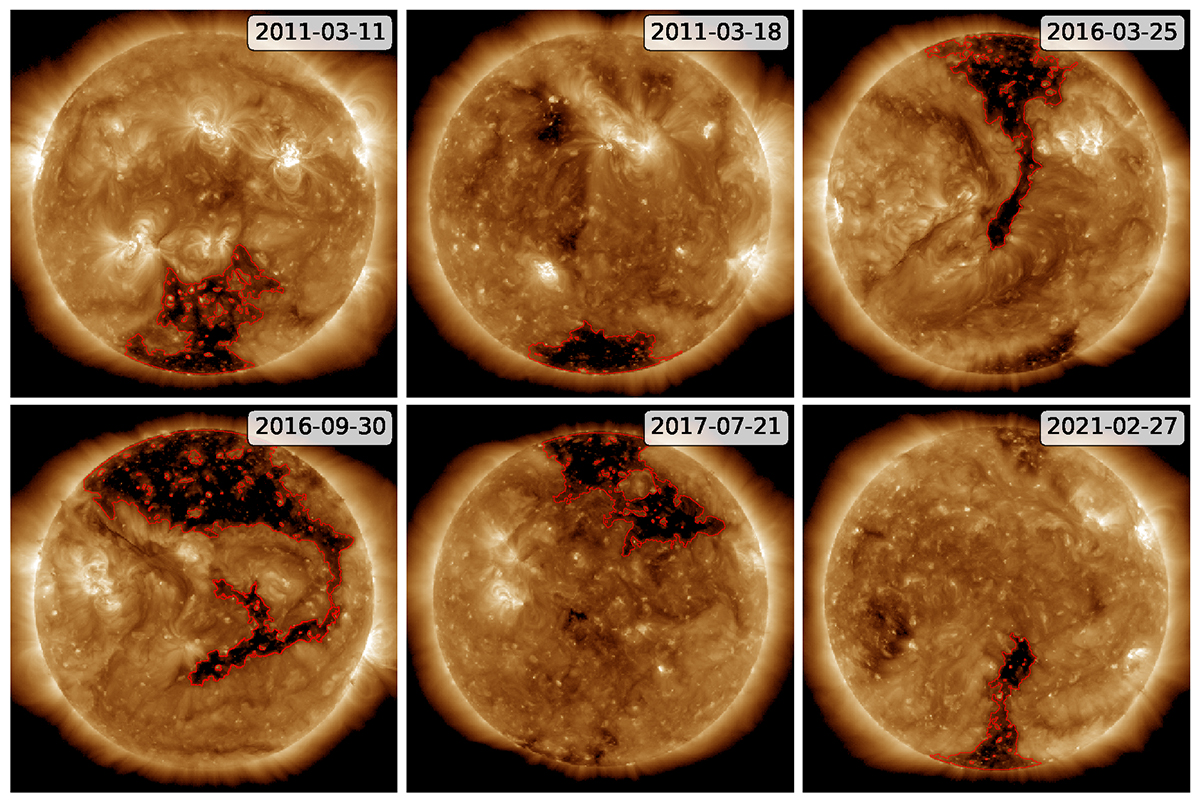
Fig. 2.
Download original image
Different polar CHs, which dominate the CH distribution at times of low solar activity, show longer convex and concave parts at their boundaries. CATCH (Heinemann et al. 2019) was used to detect the boundaries of these CHs, whose outline is marked in each panel by red curves. The background images were obtained with the Atmospheric Imager Assembly (AIA, Boerner et al. 2012; Lemen et al. 2012) on board the Solar Dynamics Observatory (SDO, Pesnell et al. 2012) in the 19.3 nm passband.
Current usage metrics show cumulative count of Article Views (full-text article views including HTML views, PDF and ePub downloads, according to the available data) and Abstracts Views on Vision4Press platform.
Data correspond to usage on the plateform after 2015. The current usage metrics is available 48-96 hours after online publication and is updated daily on week days.
Initial download of the metrics may take a while.