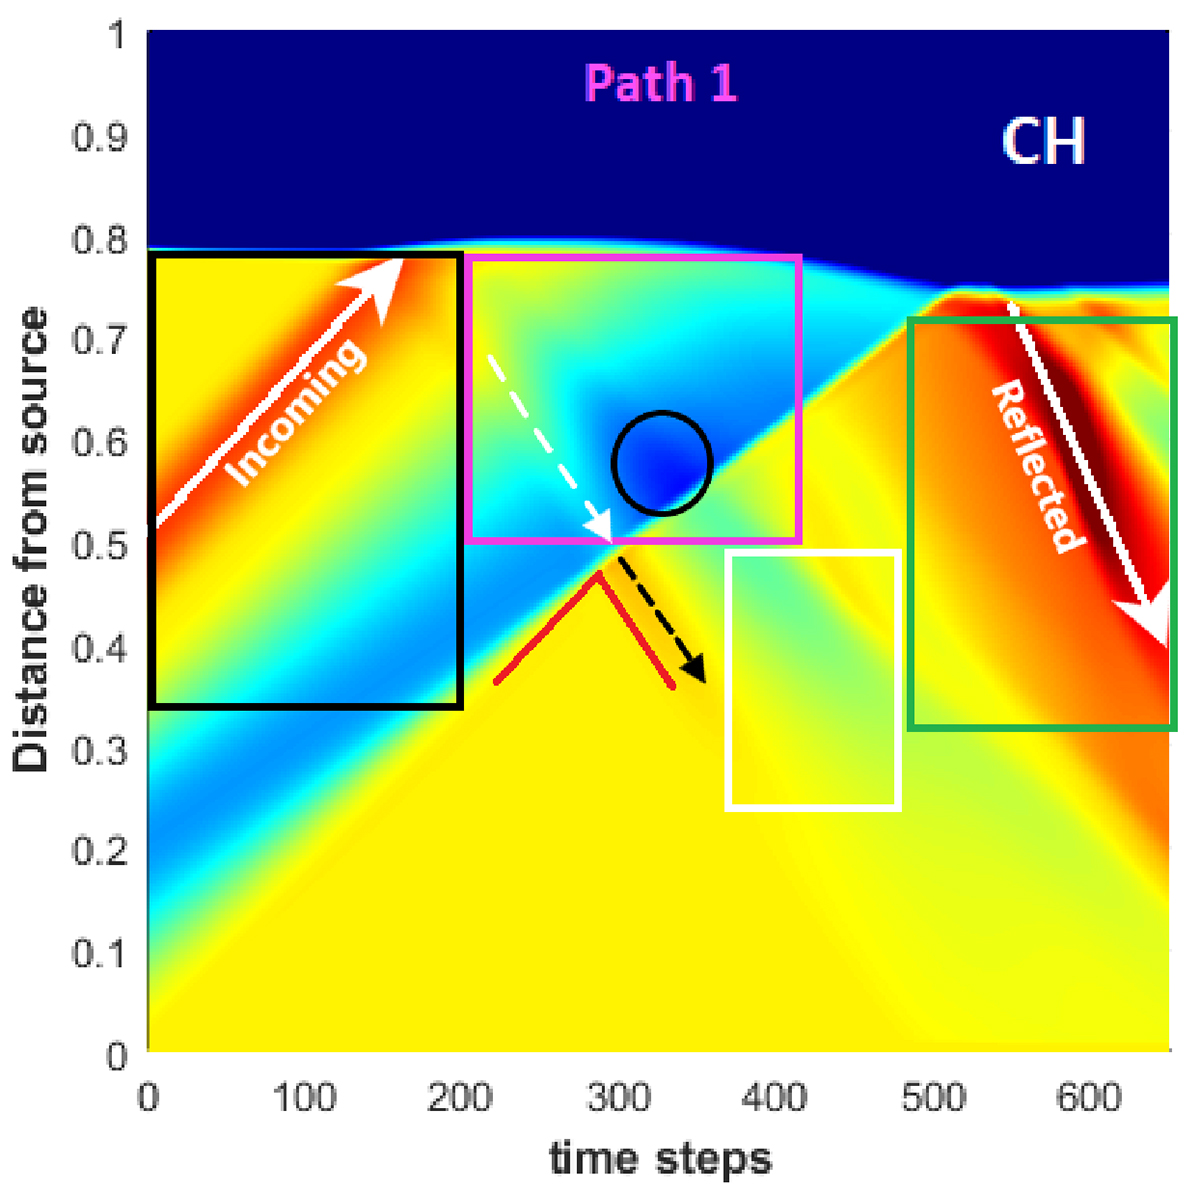
Fig. 11.
Download original image
Time-distance plot of the interaction between an incoming wave including a realistic density profile (enhancement + depletion) and an asymmetric concave CH with a CH density of ρCH = 0.1 and an initial density amplitude of ρIAP = 1.1, created along the central path (Path1, magenta). The black rectangle denotes the area in which the incoming wave moves towards the CH and no interaction has taken place so far. The magenta rectangle shows the part of the interaction in which no density value higher than the background density level can be detected, and the black circle within the magenta rectangle denotes the area in which the density structure reaches its minimum value. The area that is enclosed by the green rectangle represents the region in which the reflected wave can be seen as an enhanced wave again, always reaching values higher than the background density and even reaching density values more than twice those of the incoming wave (dark red area). The white rectangle denotes the area where the reflected wave mostly travels as a depletion and none of the strong enhanced reflected wave parts is visible so far. The dashed white and black lines denote the paths of a first reflection that travels through the rear part of the still incoming wave.
Current usage metrics show cumulative count of Article Views (full-text article views including HTML views, PDF and ePub downloads, according to the available data) and Abstracts Views on Vision4Press platform.
Data correspond to usage on the plateform after 2015. The current usage metrics is available 48-96 hours after online publication and is updated daily on week days.
Initial download of the metrics may take a while.