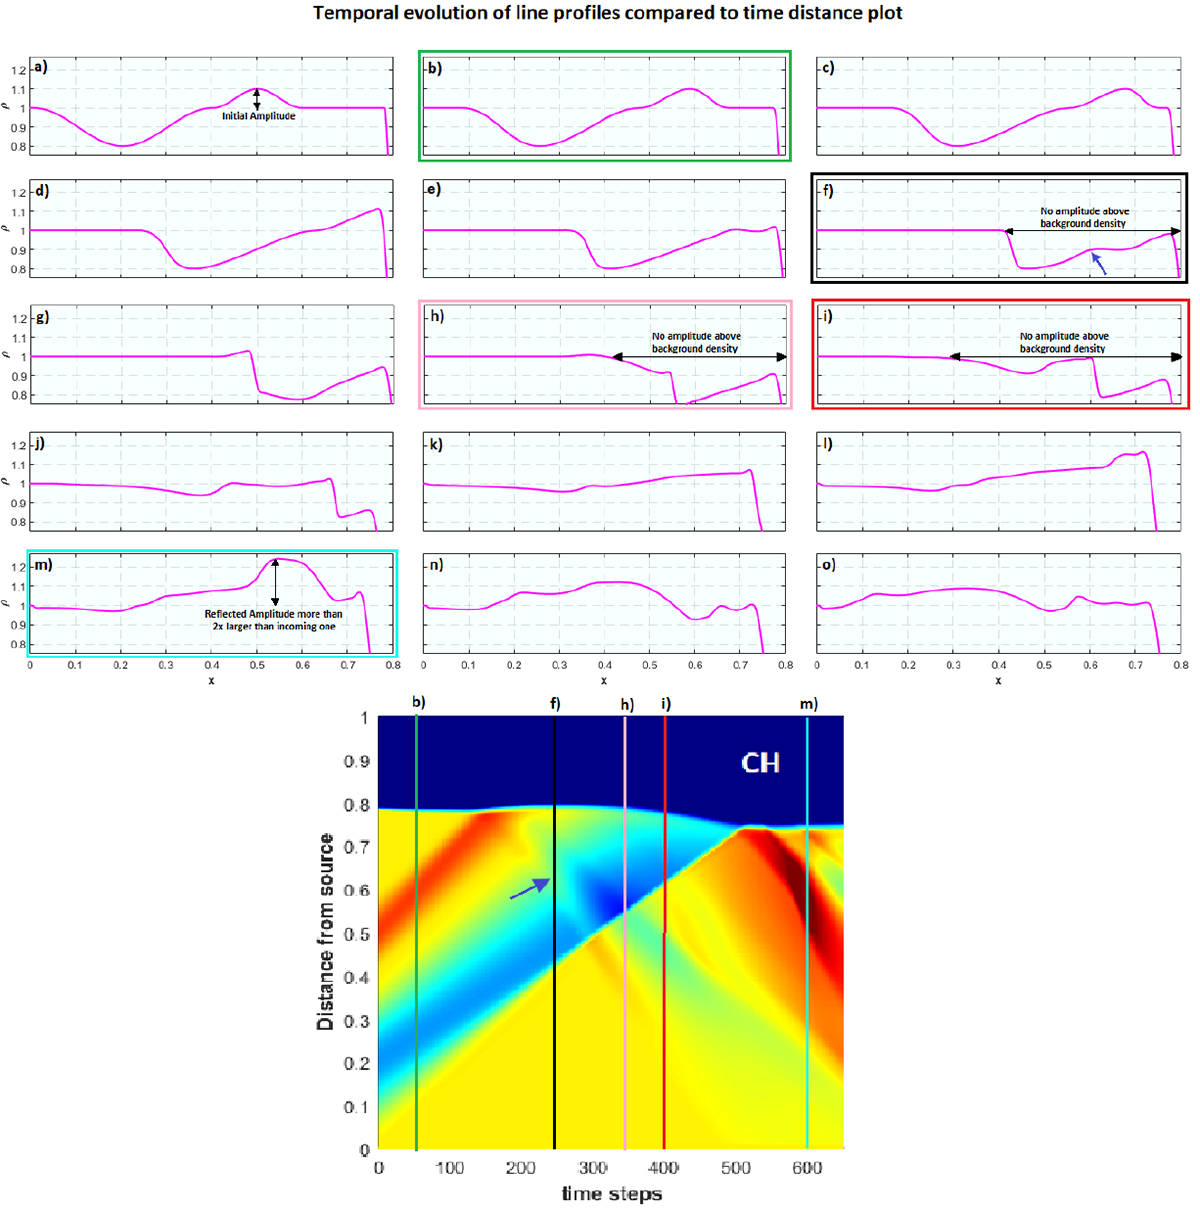
Fig. 10.
Download original image
Temporal evolution of the density wave profile (incoming and reflected wave) along Path1 (magenta) compared to the related time-distance plot of this interaction with a concave asymmetric CH. Panel a shows the initial density profile with an enhanced amplitude of ρAmpl = 1.1 and a CH density of ρCH = 0.1. Plot b is also represented as vertical green line in the time-distance plot at the bottom and shows that the incoming wave still moves towards the CH. Panel b shows that no part of the density profile reaches a value higher than the background density ρ0 = 1.0. A similar situation is shown in panels h and i. These profiles are denoted in the time-distance plot as vertical black, pink, and red lines. The temporal evolution between panels e and j clearly shows that the first reflected wave part propagates through the depleted part of the incoming wave. Panel m shows that the amplitude of the reflected wave is able to reach a value that is more than twice higher than the density amplitude of the incoming wave. This large amplitude is also shown as the dark red structure in the time-distance plot below.
Current usage metrics show cumulative count of Article Views (full-text article views including HTML views, PDF and ePub downloads, according to the available data) and Abstracts Views on Vision4Press platform.
Data correspond to usage on the plateform after 2015. The current usage metrics is available 48-96 hours after online publication and is updated daily on week days.
Initial download of the metrics may take a while.