Fig. 5
Download original image
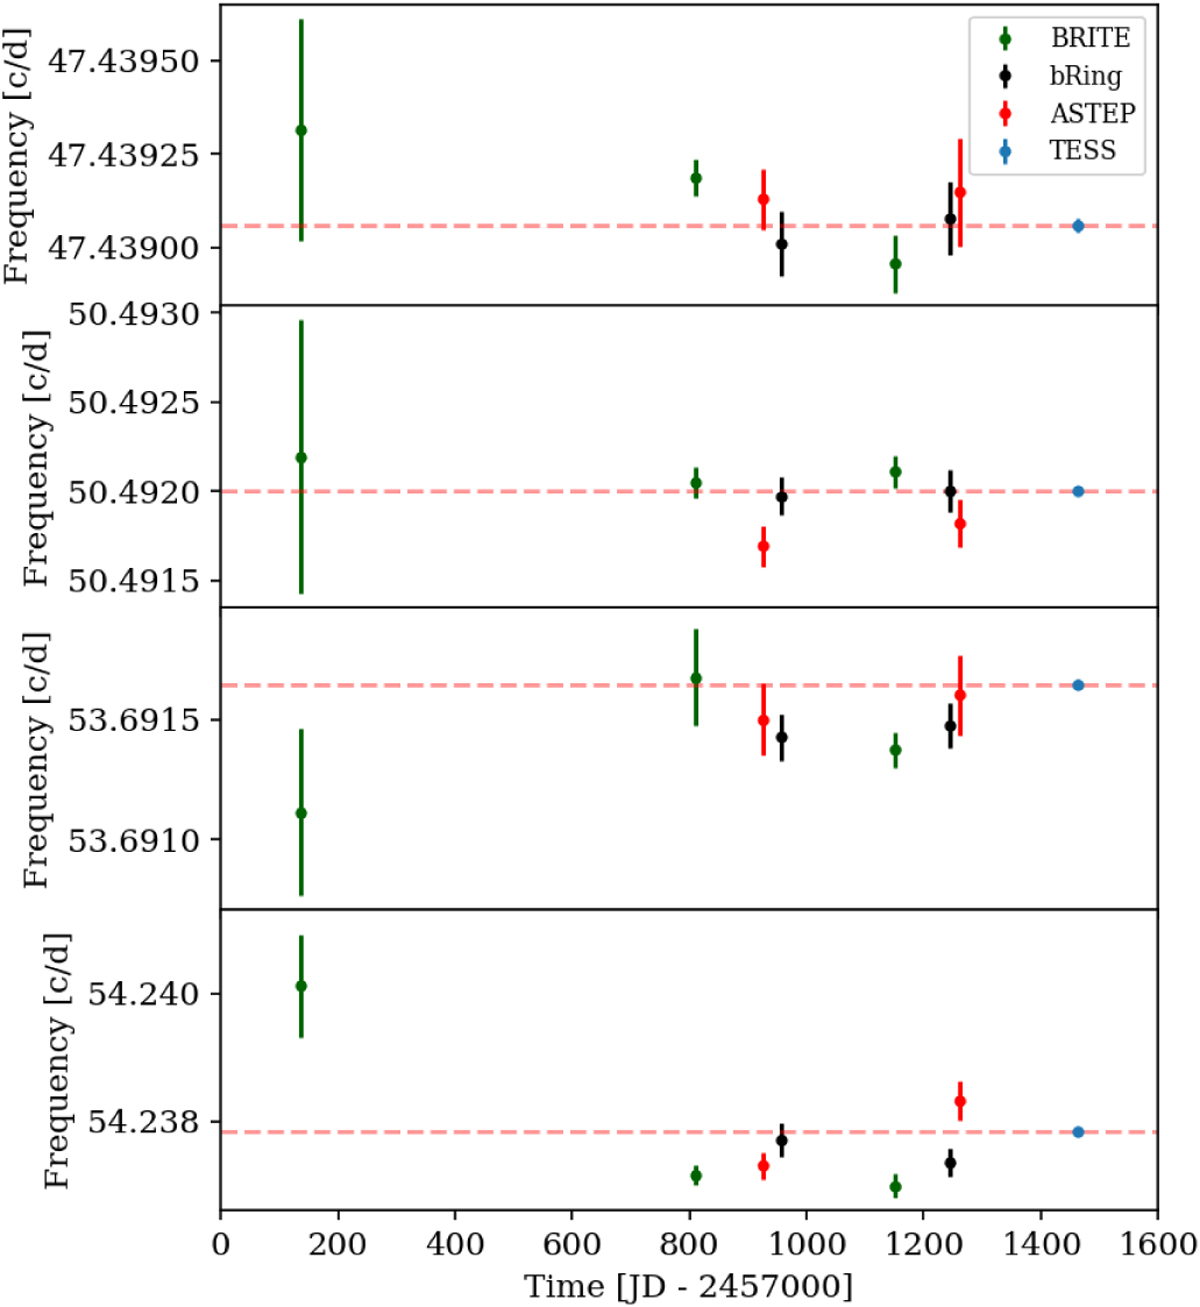
Frequencies and their uncertainties over all data sets for the four modes that are visible in all observations from the four different observatories. The dashed red line marks the frequency determined by the TESS mission, which has the smallest uncertainties. The uncertainties were calculated following Montgomery & Odonoghue (1999).
Current usage metrics show cumulative count of Article Views (full-text article views including HTML views, PDF and ePub downloads, according to the available data) and Abstracts Views on Vision4Press platform.
Data correspond to usage on the plateform after 2015. The current usage metrics is available 48-96 hours after online publication and is updated daily on week days.
Initial download of the metrics may take a while.