Fig. 8.
Download original image
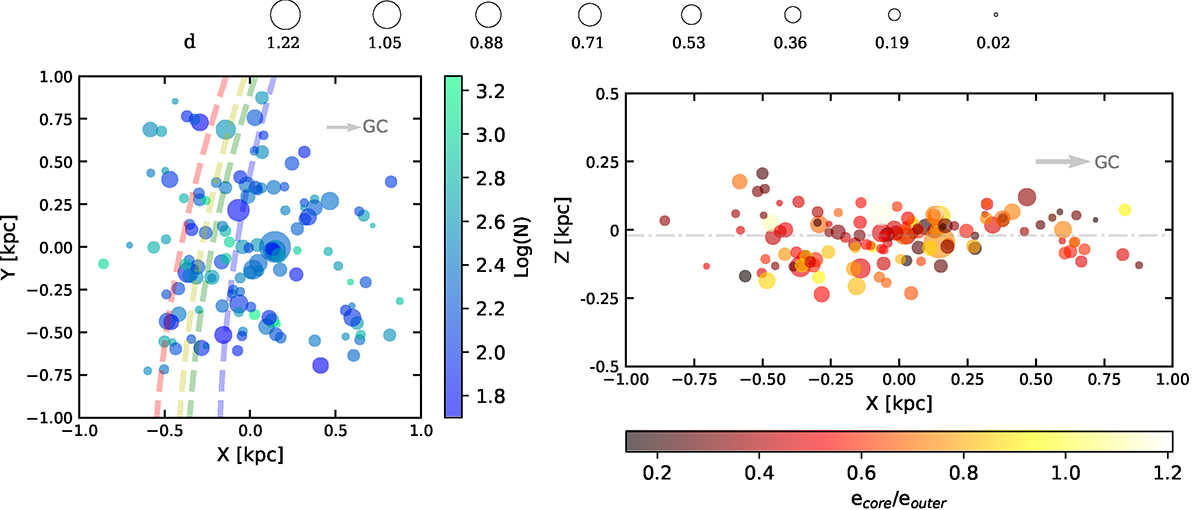
Distribution of the sample clusters on the plane of the galactic disk (left). Each circle represents a sample cluster, with its size proportional to the MD of the sample, and its color is coded according to the members’ number of the sample clusters. The different colored dashed lines indicate the positions of the local arm detected by different types of tracers, the data involved was from Hao et al. (2021). Distribution of the sample clusters on the profile map of the disk (right). Each circle represents one cluster, with its size being proportional to the cluster’s MD and its color coded according to the cluster’s ER. The dot-dashed line denotes the mid-plane (Z ≥ −20.8 pc) of the disk.
Current usage metrics show cumulative count of Article Views (full-text article views including HTML views, PDF and ePub downloads, according to the available data) and Abstracts Views on Vision4Press platform.
Data correspond to usage on the plateform after 2015. The current usage metrics is available 48-96 hours after online publication and is updated daily on week days.
Initial download of the metrics may take a while.