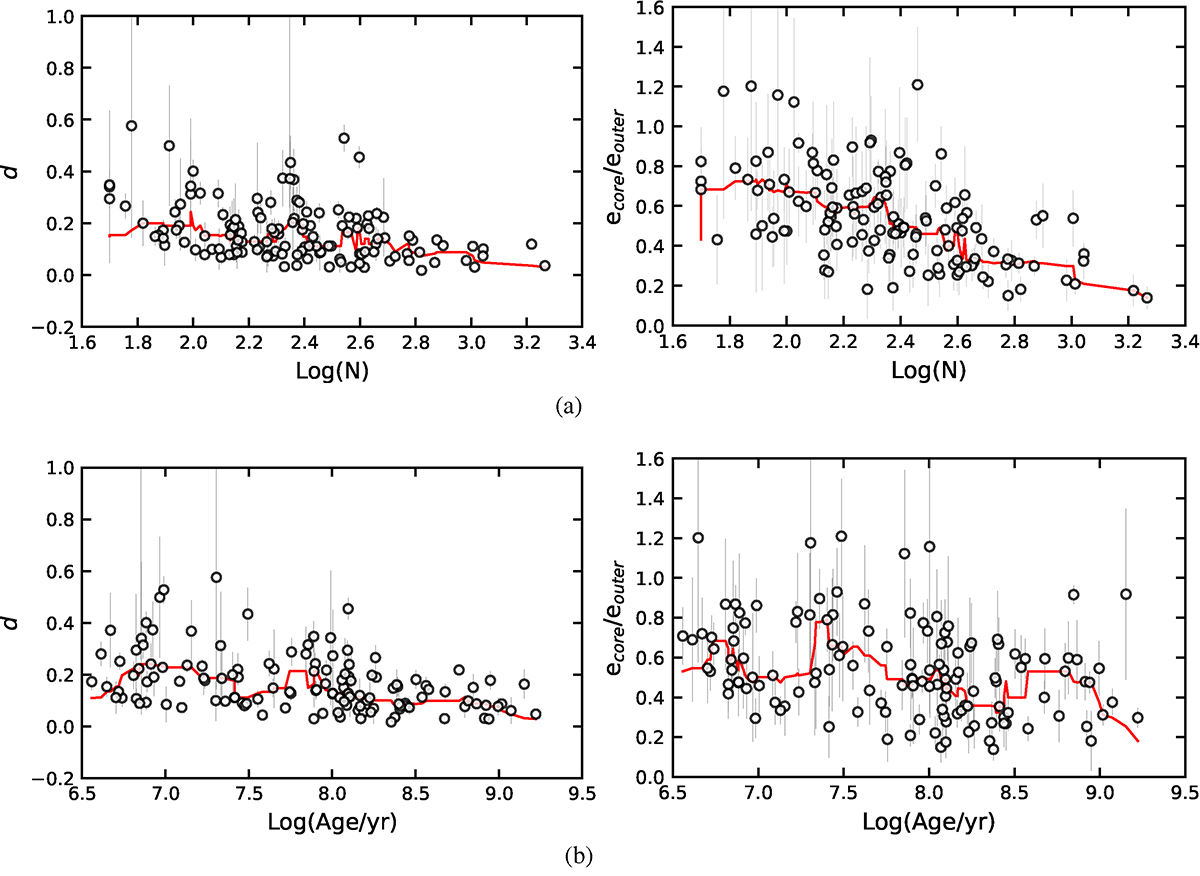
Fig. 7.
Download original image
Morphological coherence (MD and ER) versus the fundamental parameters. The open circles in all panels represent the sample clusters, with the black bars being the errors of the morphological coherence (MD and ER). The red curves indicate the median filter lines of all distributions. (a) Distributions of the MD and ER of sample clusters with their members’ number. (b) Distributions of the MD and ER of sample clusters with their ages.
Current usage metrics show cumulative count of Article Views (full-text article views including HTML views, PDF and ePub downloads, according to the available data) and Abstracts Views on Vision4Press platform.
Data correspond to usage on the plateform after 2015. The current usage metrics is available 48-96 hours after online publication and is updated daily on week days.
Initial download of the metrics may take a while.