Fig. 6.
Download original image
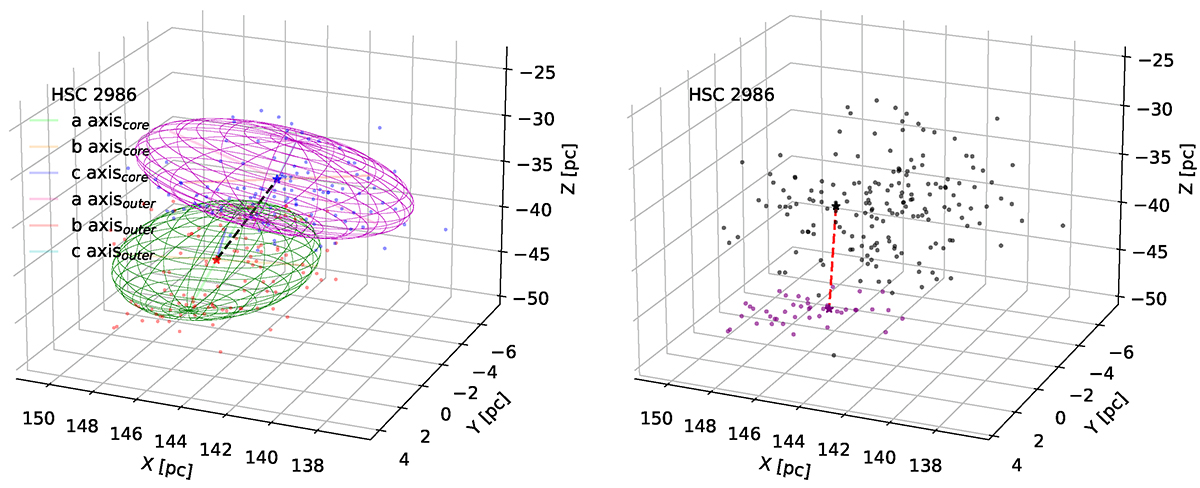
3D spatial structure of HSC 2986 and its ellipsoidal curves (left). The black dashed line indicates the unnormalized MD of HSC 2986. Other symbols and curves are the same as those in Fig. 2. 3D spatial structure of HSC 2986 (right). The purple and black dots are divided by the Gaussian mixture model (GMM) method, with the red dashed line meaning the unnormalized MD of HSC 2986. The purple and black pentagrams are the maximum points of the density of the purple and black scatter distribution.
Current usage metrics show cumulative count of Article Views (full-text article views including HTML views, PDF and ePub downloads, according to the available data) and Abstracts Views on Vision4Press platform.
Data correspond to usage on the plateform after 2015. The current usage metrics is available 48-96 hours after online publication and is updated daily on week days.
Initial download of the metrics may take a while.