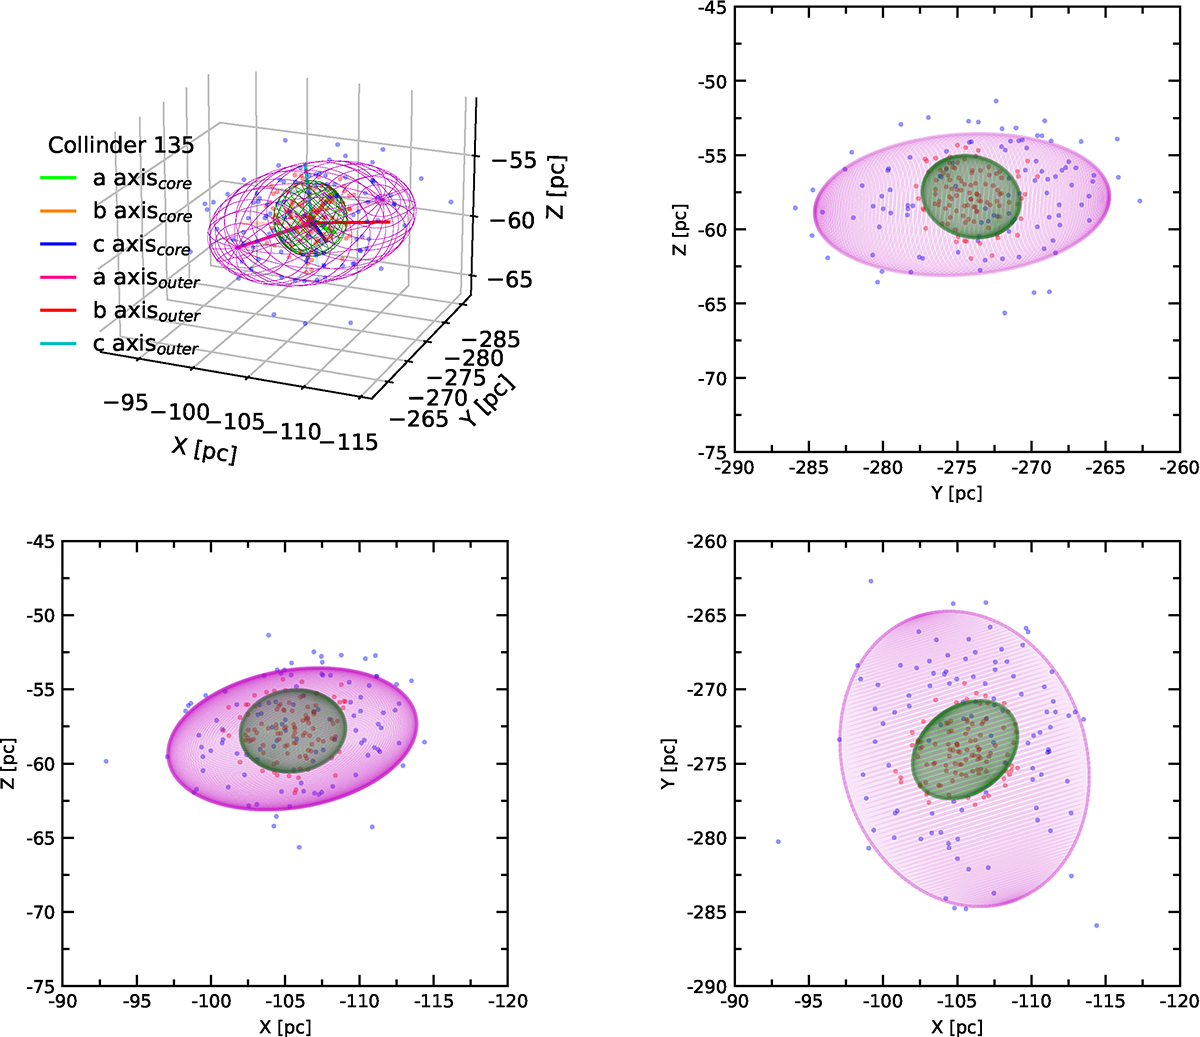
Fig. 2.
Download original image
3D spatial structure of Collinder 135, with ellipsoidal curves and its three projections. The green ellipsoid with its fitted center position (red pentagram) denotes the core region of the sample cluster, with the purple ellipsoid with its fitted center (blue pentagram) marking its outer structure. The small red and blue dots represent the members of the cluster in the core and outer regions, respectively. The different colored bars represent the different axes of the ellipsoids, respectively, as shown in the legend. The green and purple shaded areas in the three projections (XY plane, XZ plane, and YZ plane) indicate the core projections of the cluster and its shell projections, respectively.
Current usage metrics show cumulative count of Article Views (full-text article views including HTML views, PDF and ePub downloads, according to the available data) and Abstracts Views on Vision4Press platform.
Data correspond to usage on the plateform after 2015. The current usage metrics is available 48-96 hours after online publication and is updated daily on week days.
Initial download of the metrics may take a while.