Fig. 3
Download original image
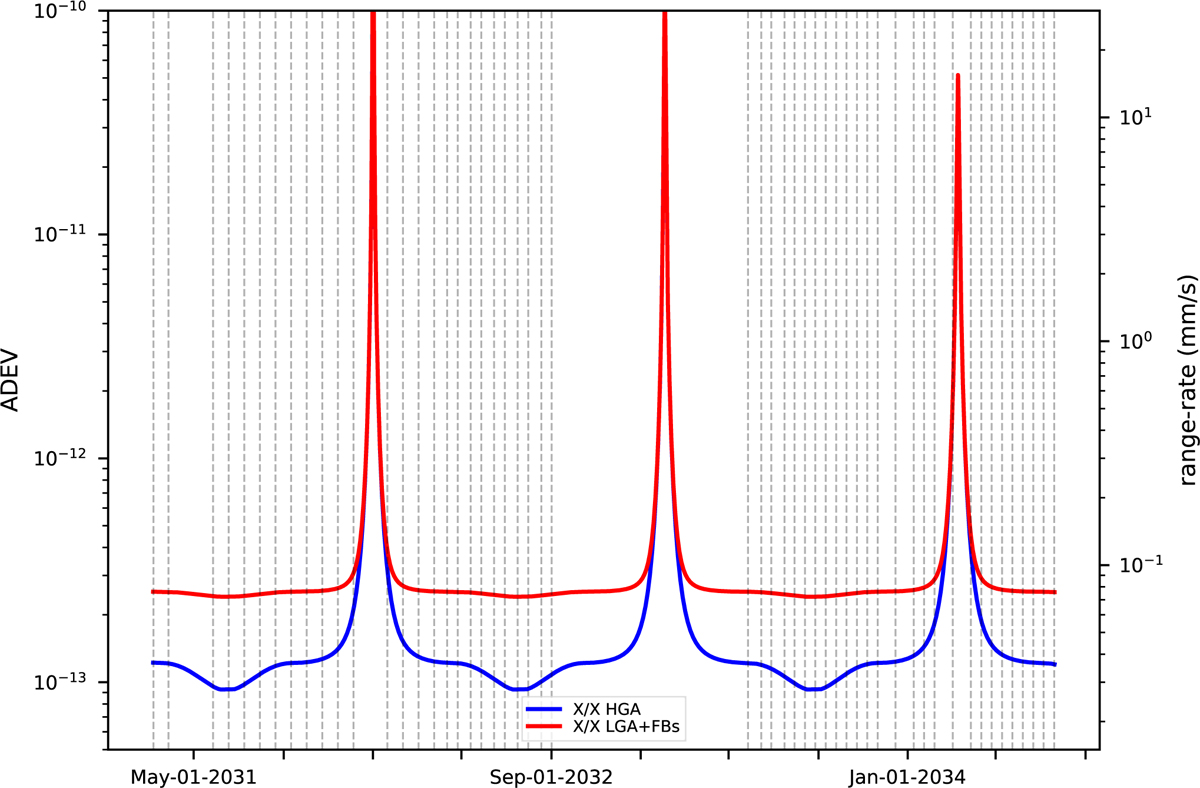
Expected Doppler noise during the Europa Clipper mission–at an integration time of 60 s–in terms of Allan standard deviation (left) and two-way range rate (right). The expected noise during the FBs and LGA tracking is shown in red, and the noise using the HGA is shown in blue. The vertical dashed lines represent the Europa Clipper flybys of Europa.
Current usage metrics show cumulative count of Article Views (full-text article views including HTML views, PDF and ePub downloads, according to the available data) and Abstracts Views on Vision4Press platform.
Data correspond to usage on the plateform after 2015. The current usage metrics is available 48-96 hours after online publication and is updated daily on week days.
Initial download of the metrics may take a while.