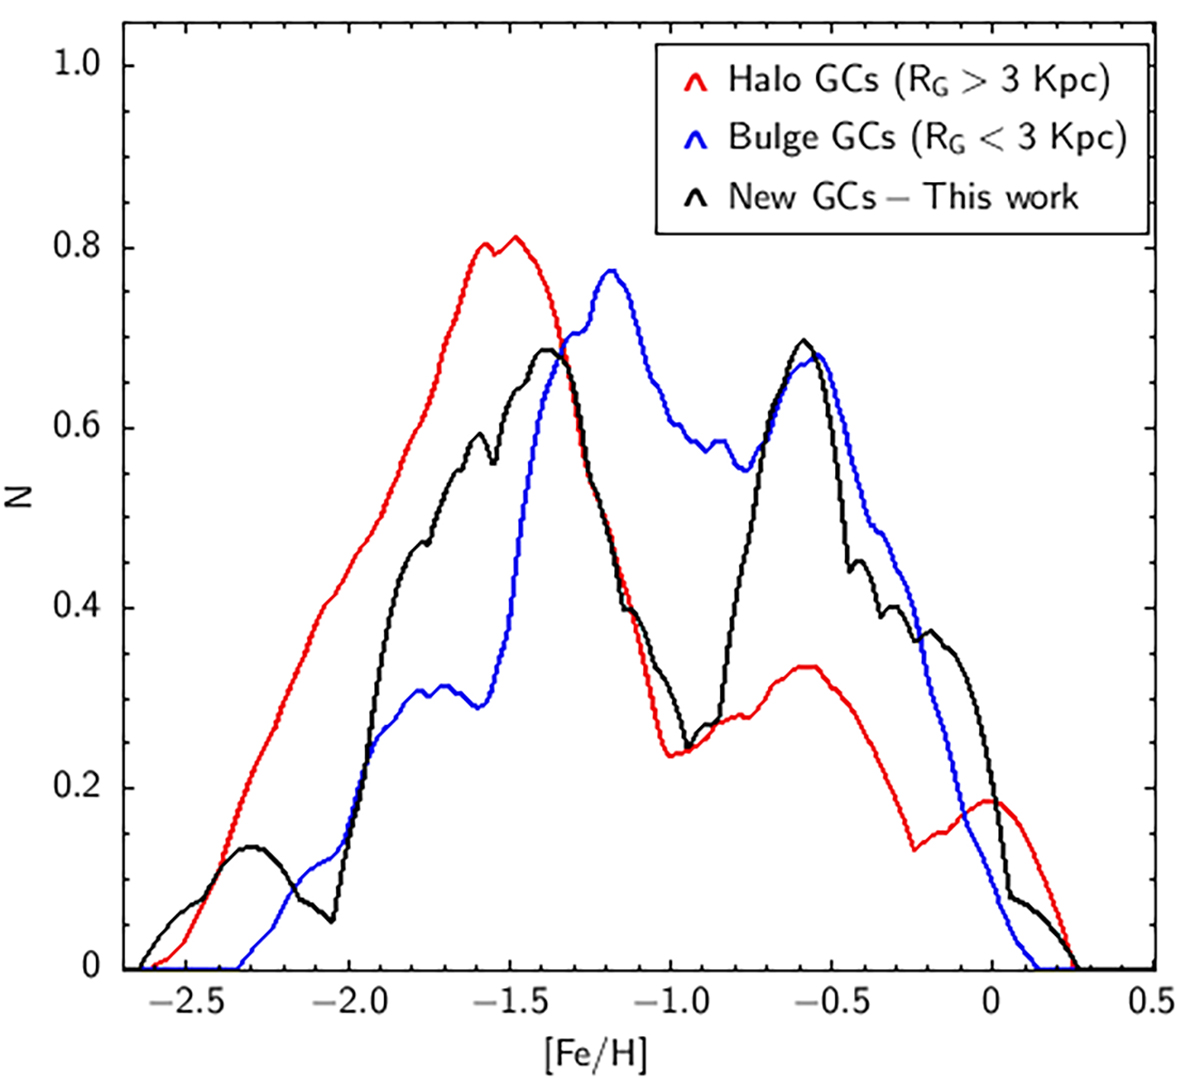
Fig. 6.
Download original image
Same details as in Fig. 5 (right panel). We split the Harris (1996) (2010 edition) GC catalog into inner (bulge) GCs located at RG < 3 kpc (red line) and outer (halo) GCs at RG > 3 kpc (blue line). The new GCs sample is drawn in black line. We use this comparison to better understand the separation between bulge and halo clusters and to show that new GCs sample follow a similar trend as the inner GCs.
Current usage metrics show cumulative count of Article Views (full-text article views including HTML views, PDF and ePub downloads, according to the available data) and Abstracts Views on Vision4Press platform.
Data correspond to usage on the plateform after 2015. The current usage metrics is available 48-96 hours after online publication and is updated daily on week days.
Initial download of the metrics may take a while.