Fig. 5.
Download original image
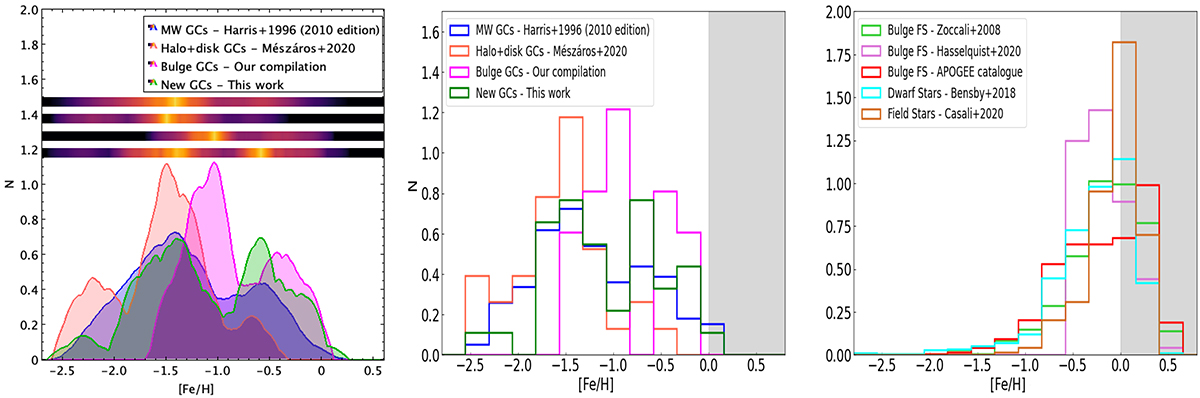
Metallicity distributions. Right and in the middle panels we show the KDEs and histograms for the known MW GCs for the Mészáros et al. (2020) (orange lines), Harris (1996) (2010 edition – blue lines), bulge GCs (Table 2 – magenta lines), and our work (green lines) samples, respectively. In the right panel, we also show the densograms in order to better discriminate the higher peaks (yellower colors) of the distributions. On the left panel, we show histograms for different samples of bulge FSs, as specified by the legend. The grey areas, in the middle and left panels, are used to point out that at metallicity [Fe/H] > 0 we do not have any GCs, while a higher percentage of bulge FSs is located at that range.
Current usage metrics show cumulative count of Article Views (full-text article views including HTML views, PDF and ePub downloads, according to the available data) and Abstracts Views on Vision4Press platform.
Data correspond to usage on the plateform after 2015. The current usage metrics is available 48-96 hours after online publication and is updated daily on week days.
Initial download of the metrics may take a while.