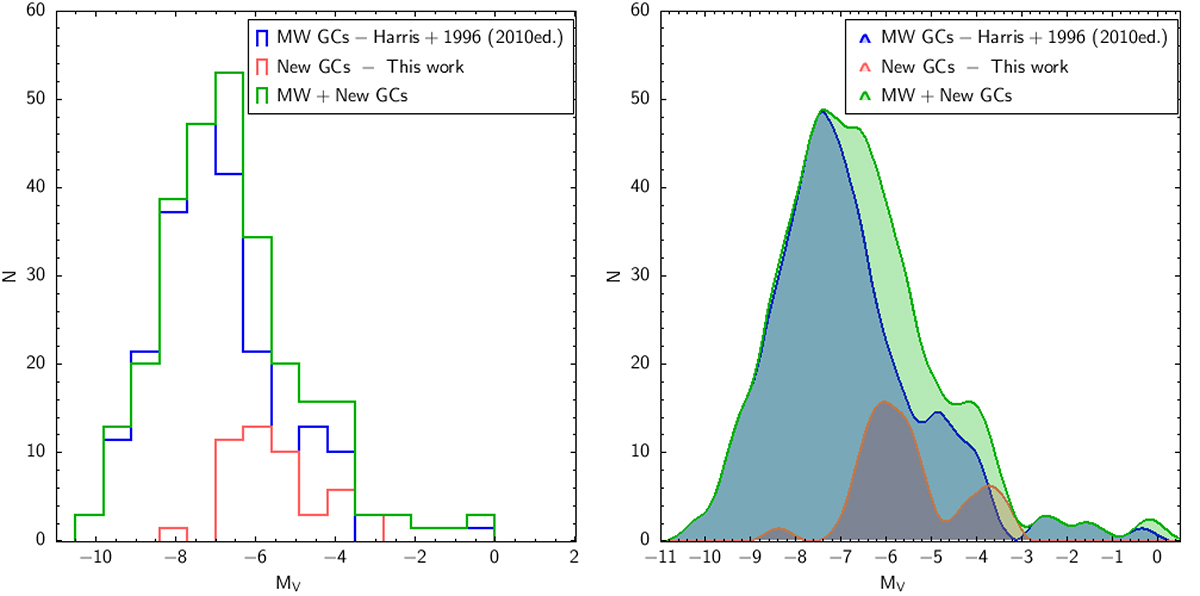
Fig. 3.
Download original image
Luminosity functions (LFs). The left panel shows three histograms depicting the LFs for the known MW GC system by Harris (1996) (2010 edition), using the dashed blue line, for the GCs analyzed in this work and listed in Table 1, using a dashed orange line and the sum of the two mentioned distributions in the green line. In the right panel, we show the LFs using the KDE technique for the three samples.
Current usage metrics show cumulative count of Article Views (full-text article views including HTML views, PDF and ePub downloads, according to the available data) and Abstracts Views on Vision4Press platform.
Data correspond to usage on the plateform after 2015. The current usage metrics is available 48-96 hours after online publication and is updated daily on week days.
Initial download of the metrics may take a while.