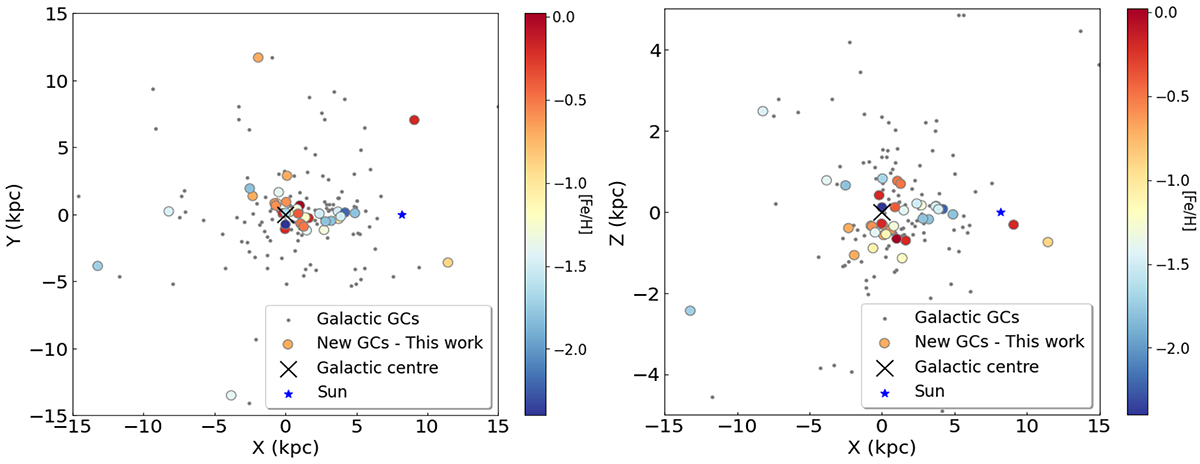
Fig. 1.
Download original image
Galactocentric distribution (XY on the left, and XZ on the right) of the GCs analyzed in the present work (colored points), highlighting clusters in the inner regions of the bulge. The known Galactic GCs positions are drawn in grey points. X measured the system’s “east-west” location, Y measured its “north-south” location, and Z measured its distance above or below the galactic plane. The marker’s color changes depending on the cluster’s metallicity, as indicated by the color bar. The black cross represents the position of the Galactic centre, while the blue star indicates the position of the Sun.
Current usage metrics show cumulative count of Article Views (full-text article views including HTML views, PDF and ePub downloads, according to the available data) and Abstracts Views on Vision4Press platform.
Data correspond to usage on the plateform after 2015. The current usage metrics is available 48-96 hours after online publication and is updated daily on week days.
Initial download of the metrics may take a while.