Fig. 8
Download original image
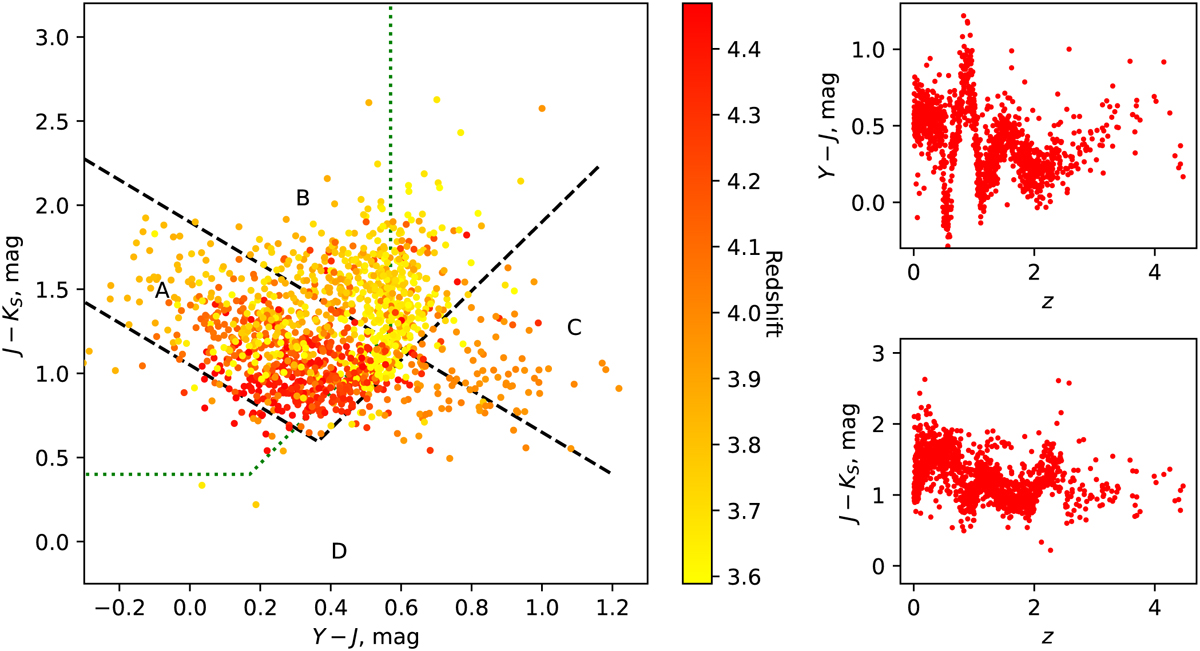
Left: color-color diagram of all spectroscopically confirmed QSOs with VISTA/VIRCAM photometry. For the notation of the regions, see Fig. 1. Right: Y–J and J–KS colors as a function of redshift for all spectroscopically confirmed QSOs with VISTA/VIRCAM photometry. The variations are driven by strong emission lines that enter and exit the band passes of individual filters.
Current usage metrics show cumulative count of Article Views (full-text article views including HTML views, PDF and ePub downloads, according to the available data) and Abstracts Views on Vision4Press platform.
Data correspond to usage on the plateform after 2015. The current usage metrics is available 48-96 hours after online publication and is updated daily on week days.
Initial download of the metrics may take a while.