Fig. 1
Download original image
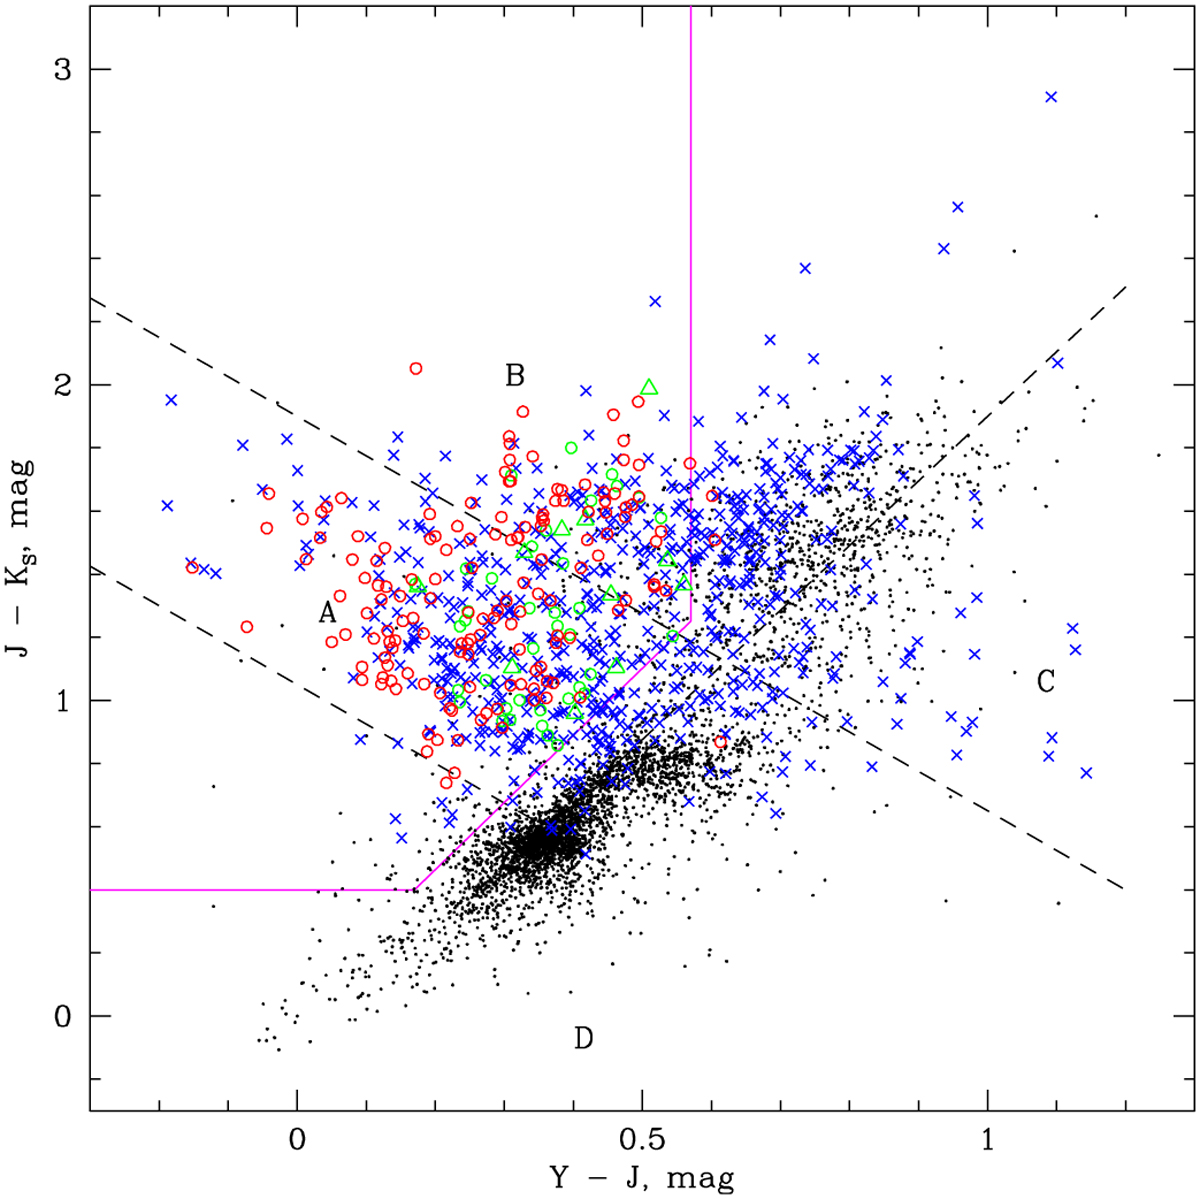
Color–color diagram showing the color selection of candidates. The dashed lines identify regions (labeled with letters) with known QSOs, and the solid magenta line marks the blue border of the planetary nebulae locus (Cioni et al. 2013). The confirmed QSOs from this work are plotted as red open circles. The open green circles and triangles mark QSOs and non-QSOs from Ivanov et al. (2016), respectively. The blue crosses indicate VMC counterparts to the spectroscopically confirmed QSOs from Kozłowski et al. (2013, VMC photometry selected within a matching radius of 1″). The black dots are randomly drawn LMC objects (with errors in all three bands <0.1 mag) to mark the main stellar locus; some of those in regions B and C are contaminating background galaxies.
Current usage metrics show cumulative count of Article Views (full-text article views including HTML views, PDF and ePub downloads, according to the available data) and Abstracts Views on Vision4Press platform.
Data correspond to usage on the plateform after 2015. The current usage metrics is available 48-96 hours after online publication and is updated daily on week days.
Initial download of the metrics may take a while.