Open Access
Fig. 6
Download original image
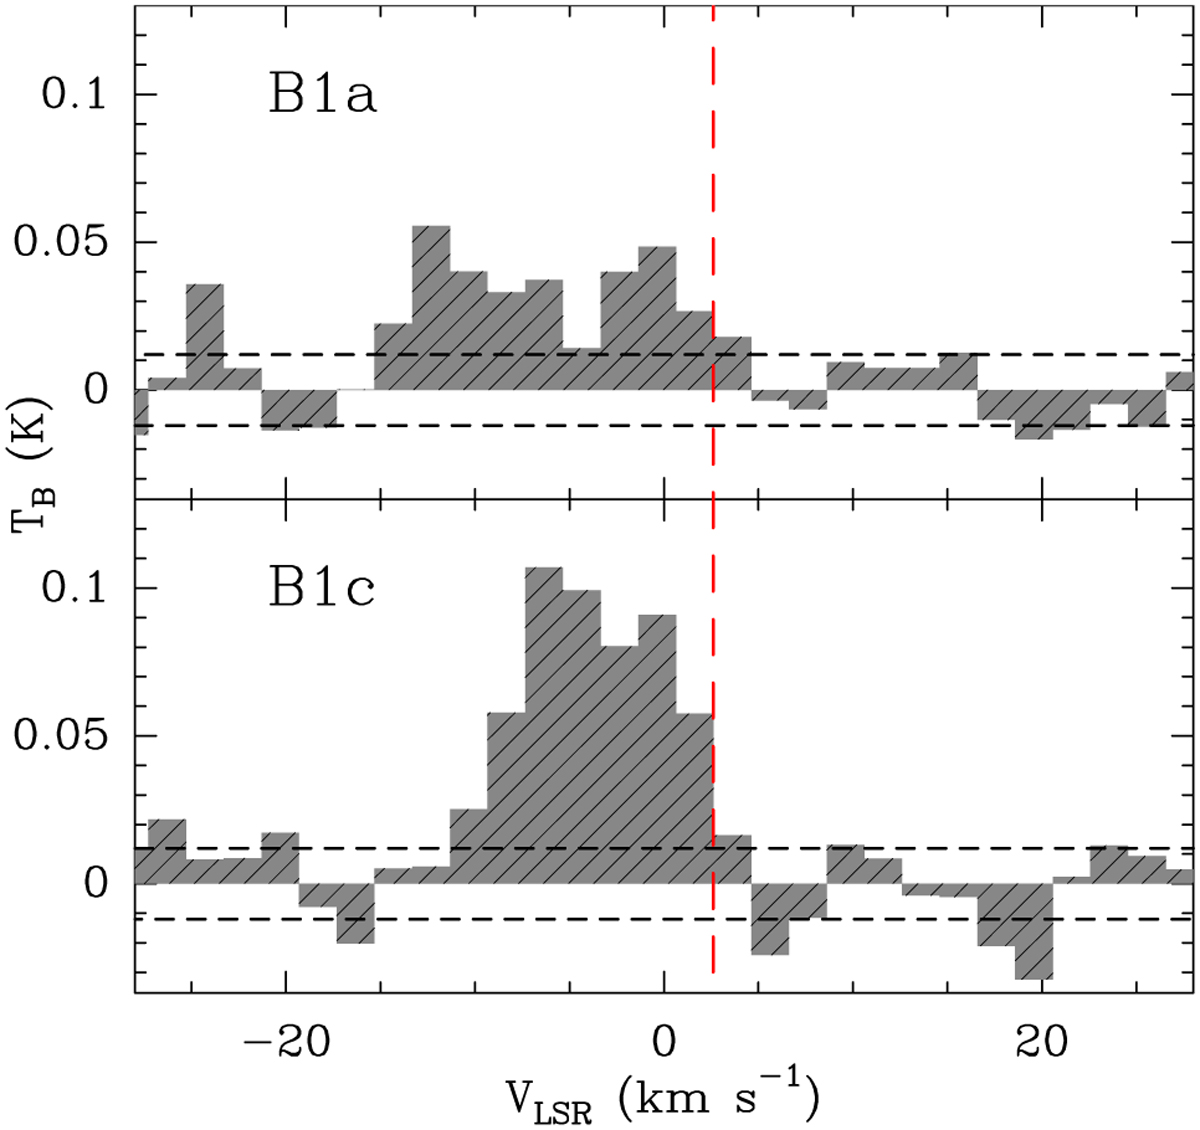
PN N = 2–1 emission detected with NOEMA towards shock positions B1a (top) and B1c (bottom). Line intensities are expressed in TB scale. The vertical red dashed line marks the systemic velocity of L1157-mm. The horizontal black dashed line marks the 1σ noise level of the spectrum (12 mK).
Current usage metrics show cumulative count of Article Views (full-text article views including HTML views, PDF and ePub downloads, according to the available data) and Abstracts Views on Vision4Press platform.
Data correspond to usage on the plateform after 2015. The current usage metrics is available 48-96 hours after online publication and is updated daily on week days.
Initial download of the metrics may take a while.