Fig. 4
Download original image
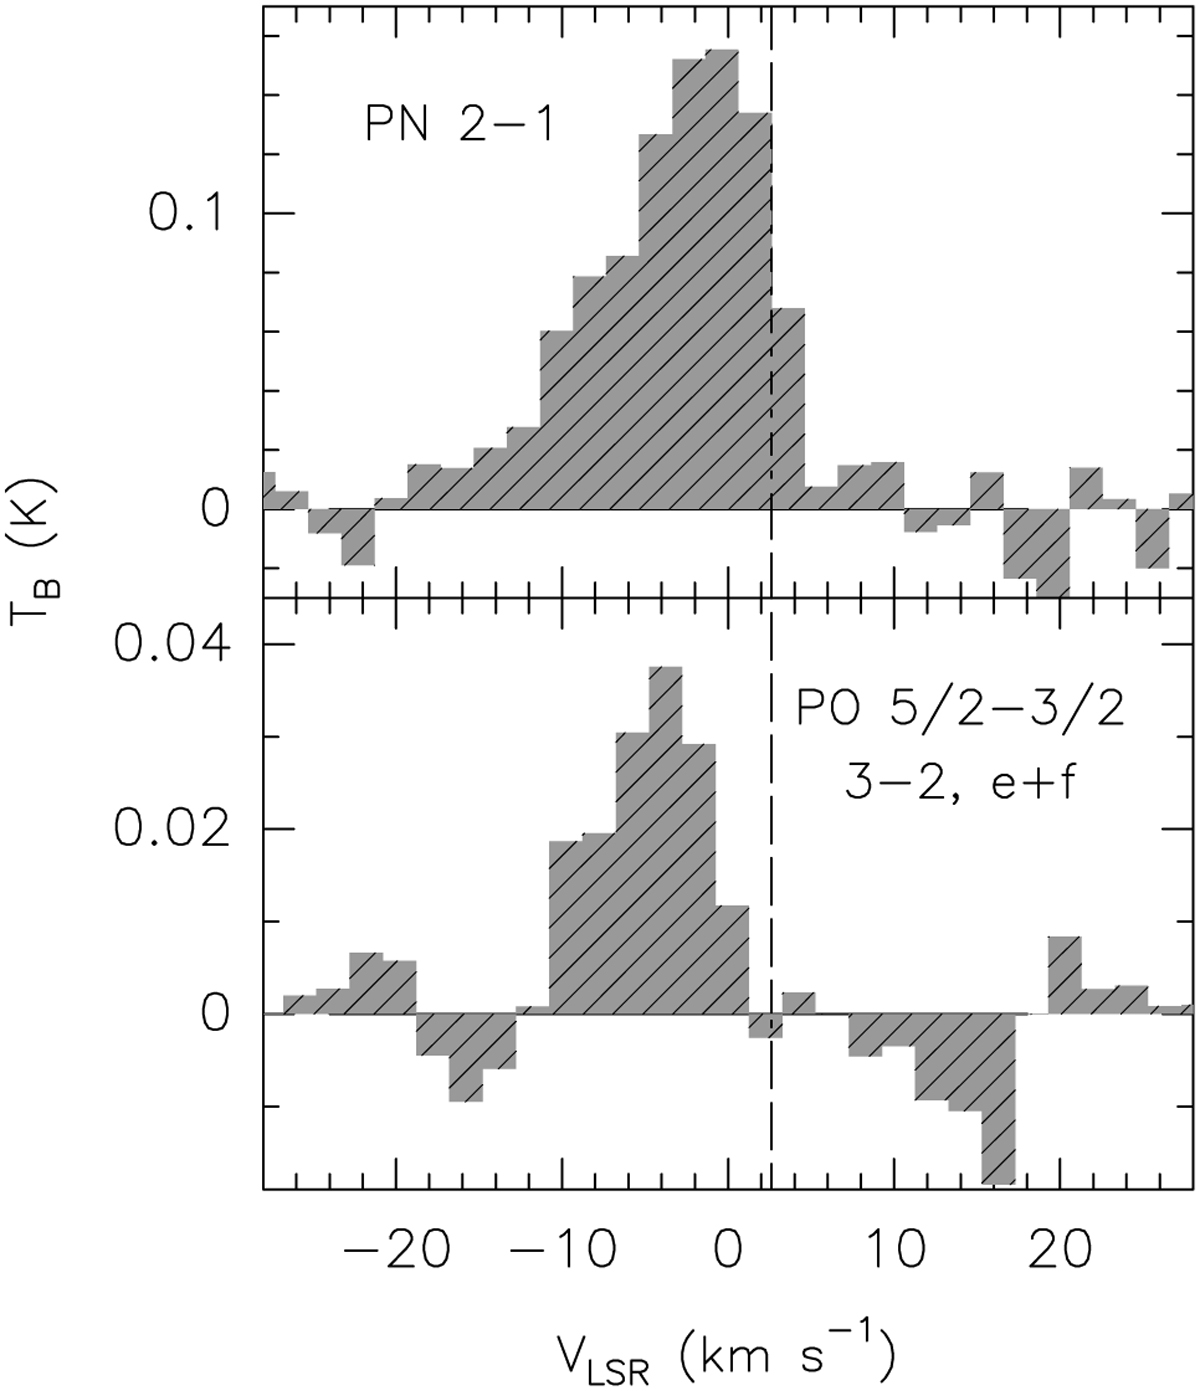
PN and PO spectra. Top: PN N = 2–1 spectrum at the peak of the PN spatial distribution. The vertical dot-dashed line marks the systemic velocity of L1157-mm. Bottom: PO emission at the peak of the spatial distribution obtained by stacking the lines 2Π1/2 J = 5/2–3/2, F = 3–2 f and 2Π1/2 J = 5/2–3/2 F = 3–2 e. Intensities are expressed in TB scale.
Current usage metrics show cumulative count of Article Views (full-text article views including HTML views, PDF and ePub downloads, according to the available data) and Abstracts Views on Vision4Press platform.
Data correspond to usage on the plateform after 2015. The current usage metrics is available 48-96 hours after online publication and is updated daily on week days.
Initial download of the metrics may take a while.