Fig. 3
Download original image
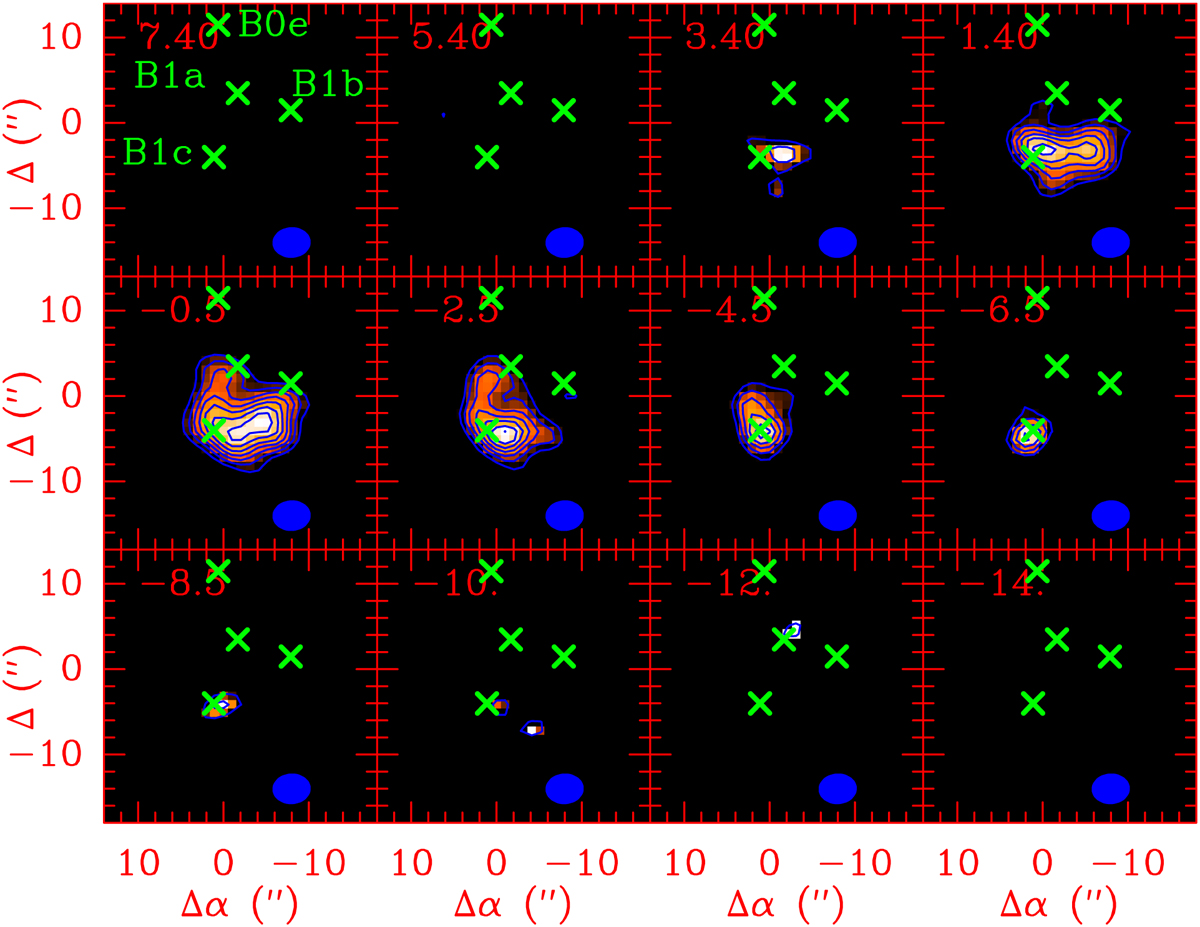
Spatial distribution of the PN N = 2–1 emission as a function of velocity, as observed with NOEMA, between −14 km s−1 and +7.4 km s−1. Each velocity channel has a width of 2 km s−1. The velocity is marked in red in the top left corner of each panel. The synthesised beam is depicted by a blue ellipse in the bottom right corner. First contour and contour interval (in blue) are 3σ and 1σ of the flux distribution, respectively. The location of the shock knots B1a-B1c and B0e are marked by green crosses.
Current usage metrics show cumulative count of Article Views (full-text article views including HTML views, PDF and ePub downloads, according to the available data) and Abstracts Views on Vision4Press platform.
Data correspond to usage on the plateform after 2015. The current usage metrics is available 48-96 hours after online publication and is updated daily on week days.
Initial download of the metrics may take a while.