Fig. 1
Download original image
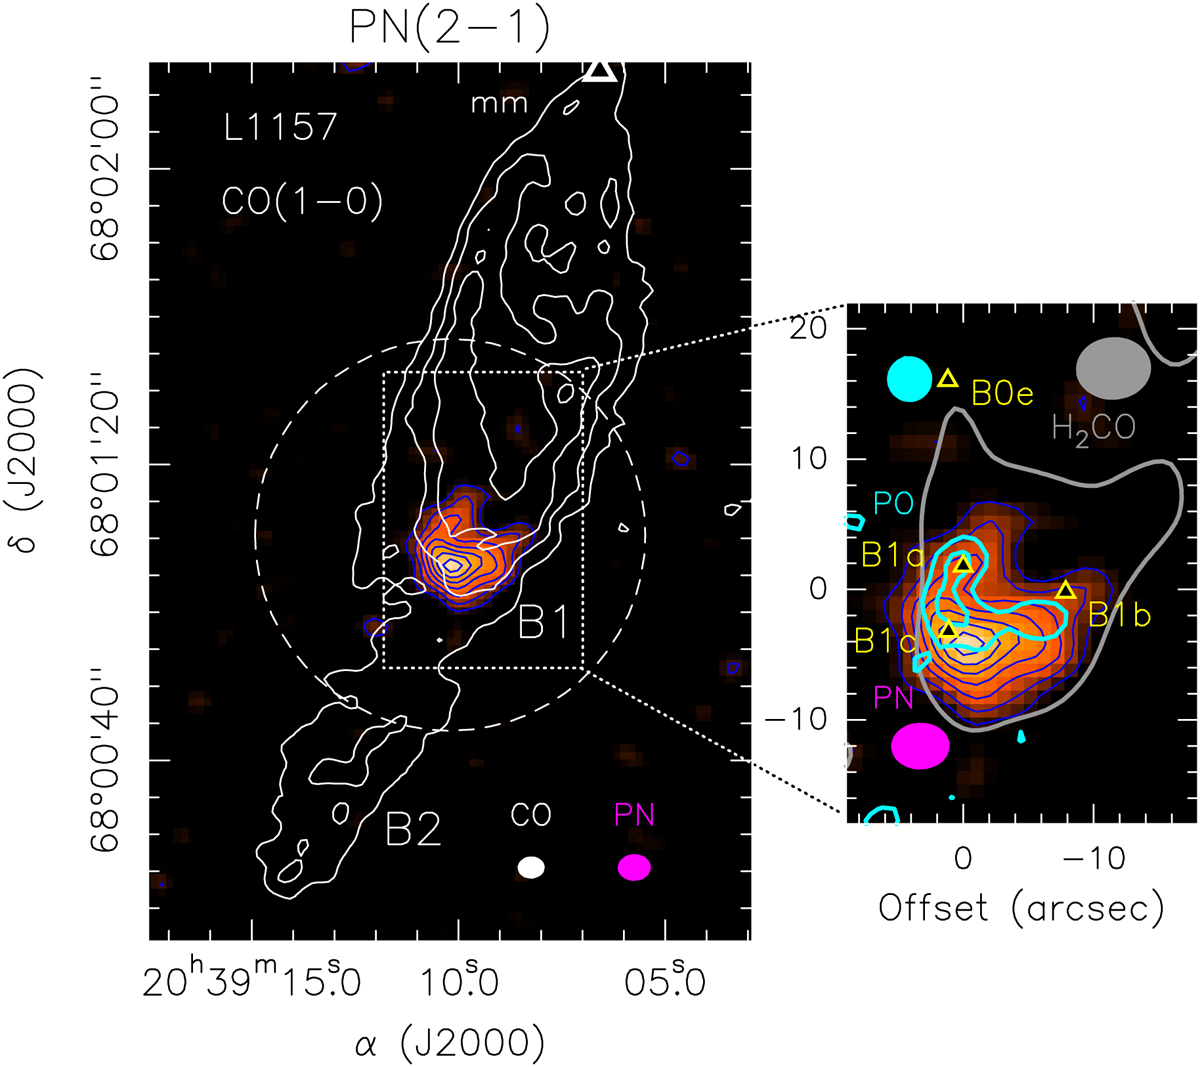
Phosphorus-bearing molecules in the L1157-B1 protostellar shock. Left: emission map of the PN N = 2–1 line obtained with NOEMA in the southern lobe of the L1157 outflow. The emission (colour) is integrated in the velocity range −10 to +5 km s−1. The first contour and contour interval (blue) are 3σ (36 mJy beam−1 km s−1) and 2σ, respectively. The dashed white circle shows the primary beam of the PN image (53″). The CO J = 1–0 outflow emission, as imaged by Gueth et al. (1996) is superimposed in white contours. The white triangle at the top points to the position of the L1157-mm protostar. Right: magnified view of the L1157-B1 central region. The maps are centred at: α(J2000) = 20h39m 10s.2, δ(J2000) = +68°01′10.″5. The PN N = 2–1 map is compared with the stacked intensity distribution of PO J = 5/23/2, F = 3–2, ef (cyan thick contours). The first contour and contour interval of the PO map are 3σ (21 mJy beam−1 km s−1) and 2σ respectively. The 3σ level of the p-H2CO J = 20,2−10,1 integrated emission (Benedettini et al. 2013; grey contours) is here used to define the whole structure of the B1 shock. The cyan ellipse draws the synthesised beam of the PO observations, and shock knots B1a-B1b-B1c-B0e are marked by yellow triangles.
Current usage metrics show cumulative count of Article Views (full-text article views including HTML views, PDF and ePub downloads, according to the available data) and Abstracts Views on Vision4Press platform.
Data correspond to usage on the plateform after 2015. The current usage metrics is available 48-96 hours after online publication and is updated daily on week days.
Initial download of the metrics may take a while.