Open Access
Fig. 3.
Download original image
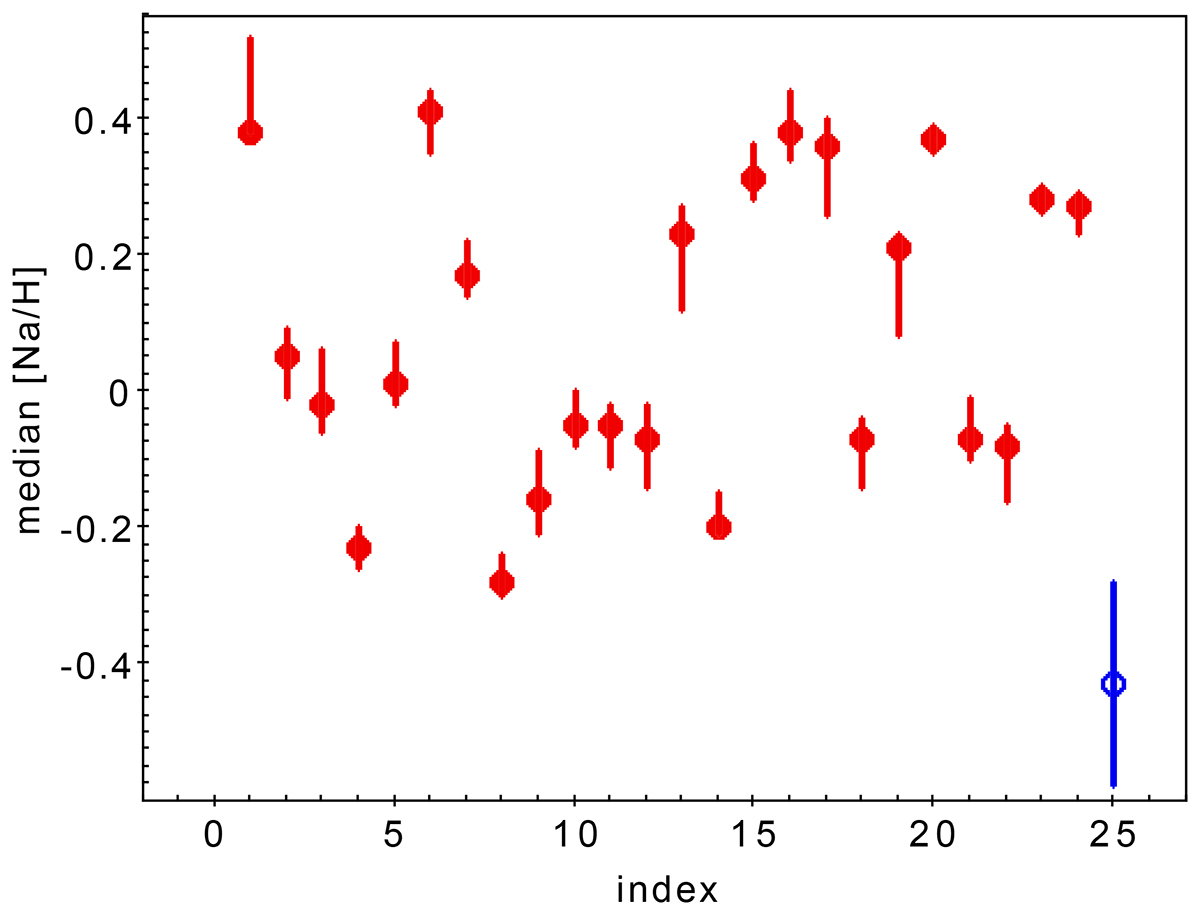
Median value of [Na/H] for OCs with at least ten valid Na values; the vertical lines indicate the first and third quartile of the distribution in each cluster, that is, the IQR for [Na/H]. The rightmost point (blue open circle) is for 47 Tuc. The value of index identifying each OC can be found in Table 1
Current usage metrics show cumulative count of Article Views (full-text article views including HTML views, PDF and ePub downloads, according to the available data) and Abstracts Views on Vision4Press platform.
Data correspond to usage on the plateform after 2015. The current usage metrics is available 48-96 hours after online publication and is updated daily on week days.
Initial download of the metrics may take a while.