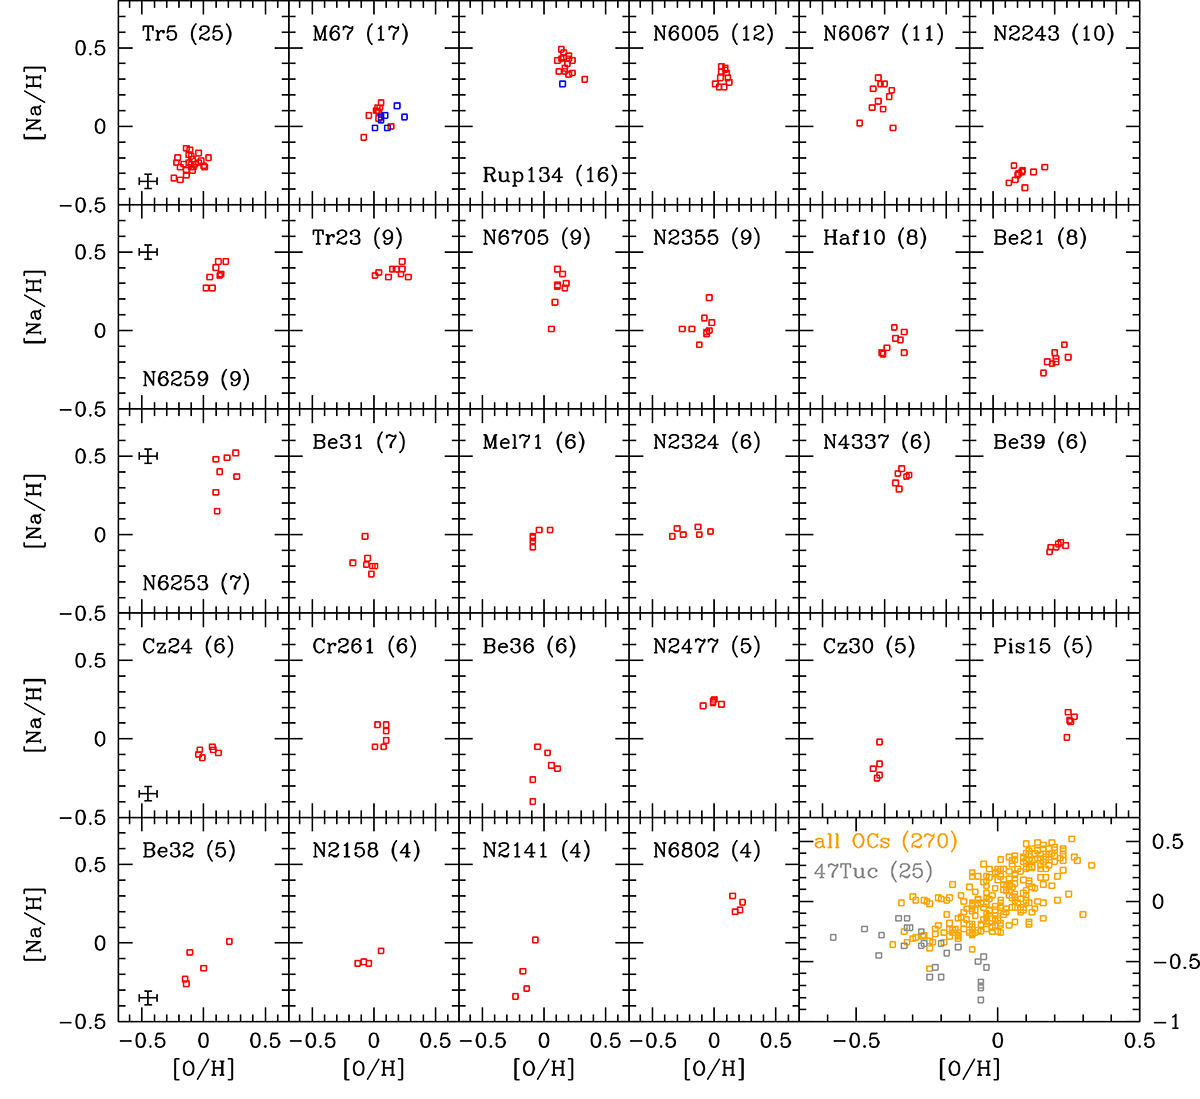
Fig. 1.
Download original image
Distribution of [Na/H] versus [O/H] for all OCs with at least four stars with valid values. The blue points for two clusters indicate dwarf stars, while all red points are for giants. The bottom right panel displays the available values in all OCs (in orange) compared to the GC 47 Tuc (grey points). Average error bars are displayed only in the first column of the plots.
Current usage metrics show cumulative count of Article Views (full-text article views including HTML views, PDF and ePub downloads, according to the available data) and Abstracts Views on Vision4Press platform.
Data correspond to usage on the plateform after 2015. The current usage metrics is available 48-96 hours after online publication and is updated daily on week days.
Initial download of the metrics may take a while.