Fig. 8
Download original image
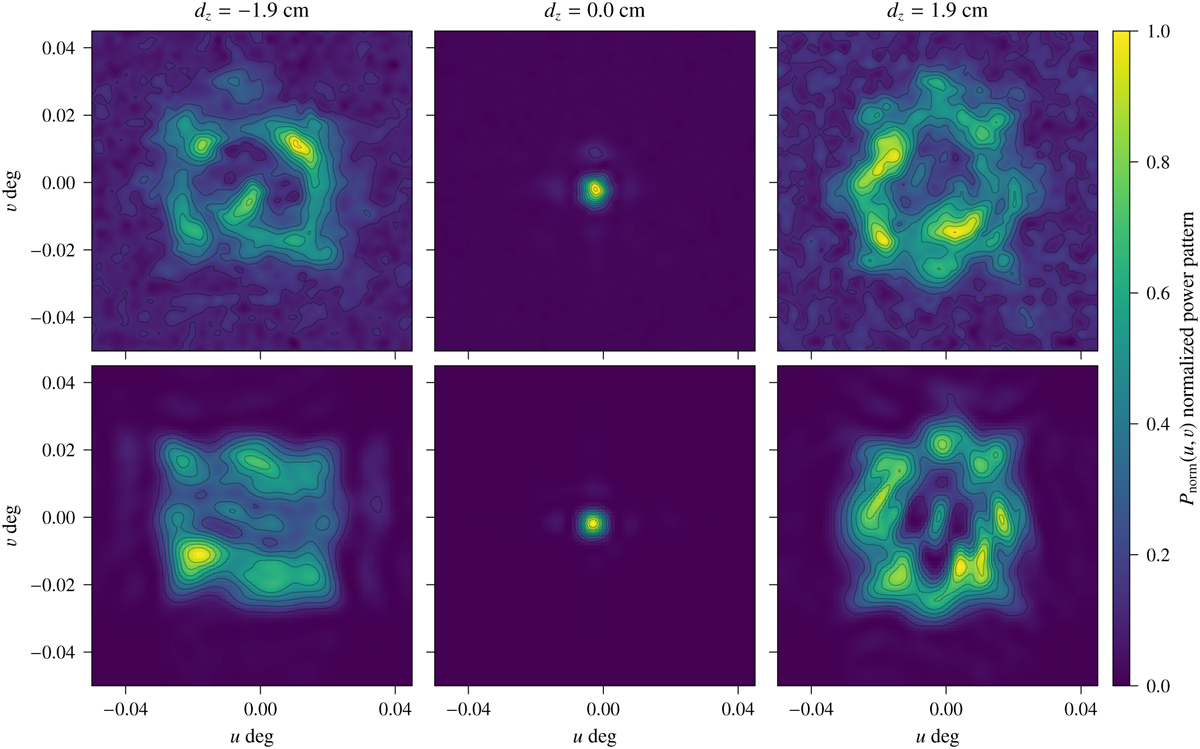
Observed (December 2019) and computed power patterns. The upper row corresponds to the 3C84 observed beam using the 7 mm receiver at a mean elevation of 48 deg (azimuth scans). The lower row shows the best fit for an n = 5. The observed focused beam (top centered panel) has a S/N of 610. We note that in the observing case, the S/N of the ±dz maps may be noisier than the simulated case in Fig. 5. Observing with a defocused telescope degrades the imaging further, increasing the observed noise level.
Current usage metrics show cumulative count of Article Views (full-text article views including HTML views, PDF and ePub downloads, according to the available data) and Abstracts Views on Vision4Press platform.
Data correspond to usage on the plateform after 2015. The current usage metrics is available 48-96 hours after online publication and is updated daily on week days.
Initial download of the metrics may take a while.