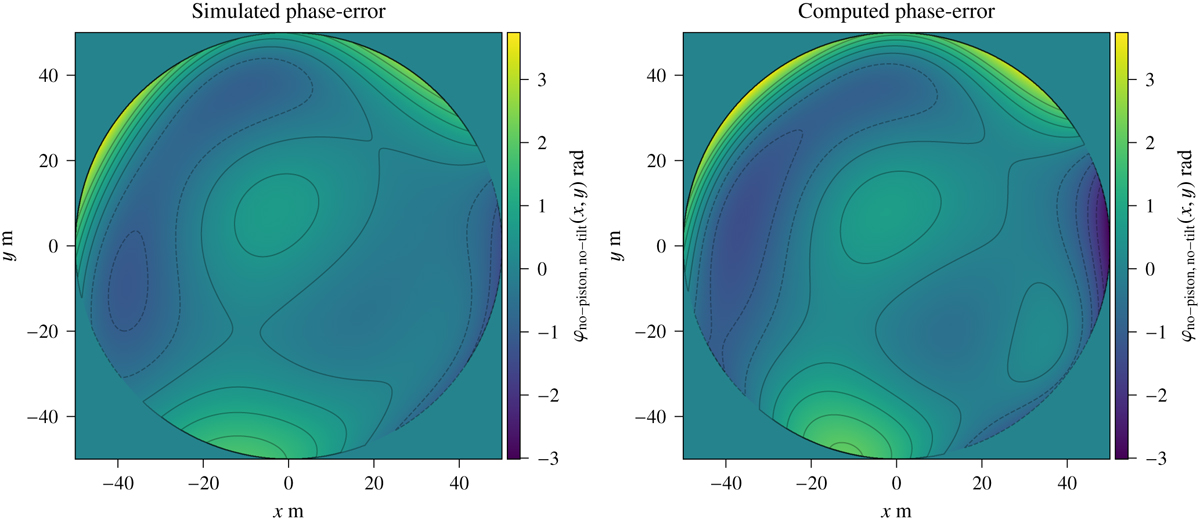
Fig. 6

Download original image
Aperture phase distribution (phase-error maps) of the simulated (left panel) and retrieved (right panel) model. The simulated Zernike circle polynomial coefficients (Knℓ) were selected randomly from a normal distribution, mean centered (µ = 0), and then σ was added until a defocused map reached a S/N level of 750. The contour lines are between −2 and 2 half-radian intervals.
Current usage metrics show cumulative count of Article Views (full-text article views including HTML views, PDF and ePub downloads, according to the available data) and Abstracts Views on Vision4Press platform.
Data correspond to usage on the plateform after 2015. The current usage metrics is available 48-96 hours after online publication and is updated daily on week days.
Initial download of the metrics may take a while.


