Fig. 14
Download original image
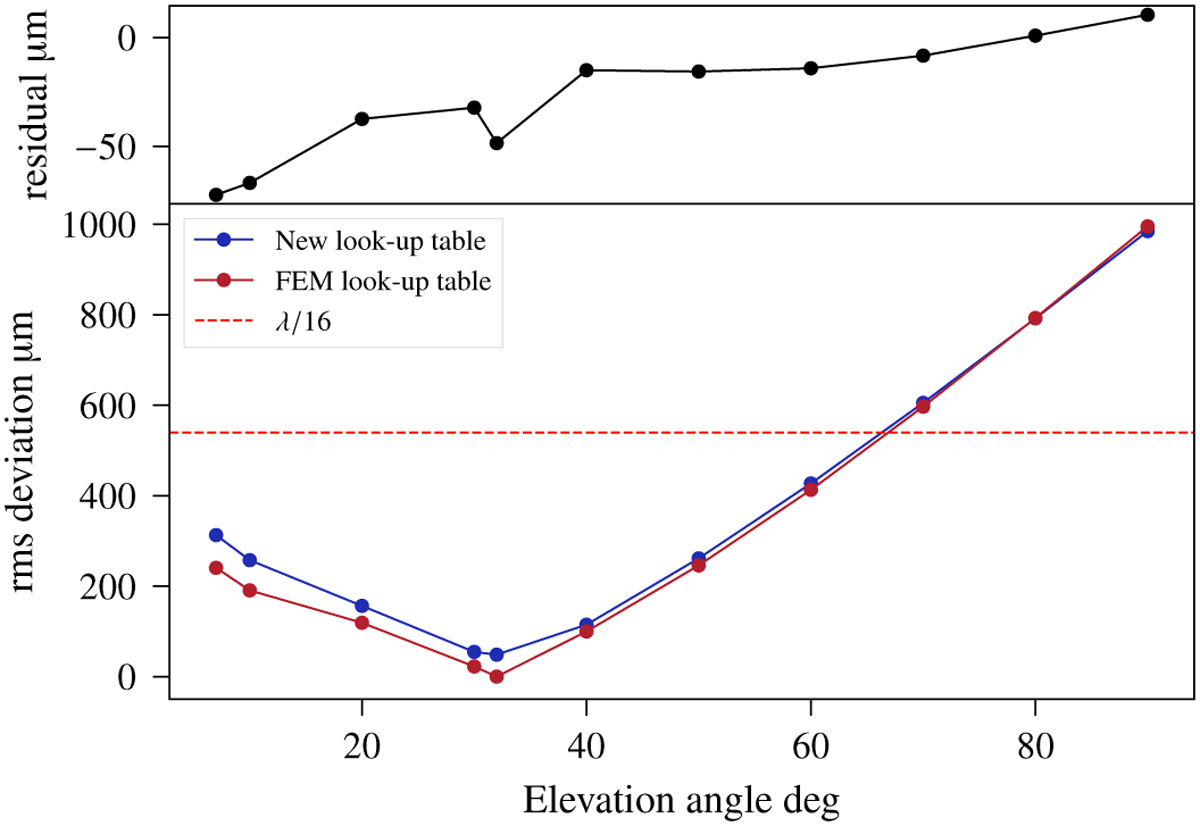
Root-mean-square deviation of the FEM φ⊥FEM and new φ⊥C look-up tables. The rms value for each case only contains the 96 actuator positions and not the entire computed phase-error map. Upper plot shows the difference from both methods. Most of the corrected deviation happens at lower elevations, where the random-surface-error efficiency dominates (see Fig. 10). The horizontal line corresponds to the traditionally defined value for a good efficiency, δrms ≤ λ/16 (εrs = 0.54), and it has been drawn only as an indicator.
Current usage metrics show cumulative count of Article Views (full-text article views including HTML views, PDF and ePub downloads, according to the available data) and Abstracts Views on Vision4Press platform.
Data correspond to usage on the plateform after 2015. The current usage metrics is available 48-96 hours after online publication and is updated daily on week days.
Initial download of the metrics may take a while.