Fig. 12
Download original image
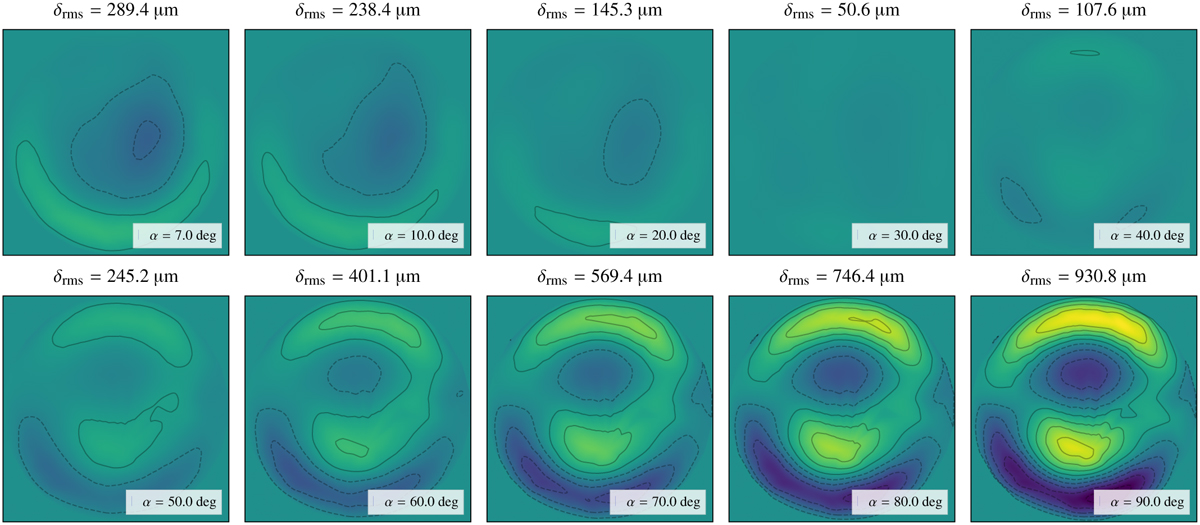
Computation of the new look-up table with OOF holography and FEM corrections. Each panel shows the expected amplitude φ⊥C per elevation α with its rms value, δrms. The table is based on the gravitational model (shown in Fig. 11) and default FEM look-up table (Fig. D.2). The table is a result of multiple OOF holography observations at several elevations in order to create a reliable gravitational model (Eq. (17)). The contour lines are between –2000 and 2000 µm, with 400 µm intervals. The values determined here correspond well to the observed main-dish deformations by Hoist et al. (2015).
Current usage metrics show cumulative count of Article Views (full-text article views including HTML views, PDF and ePub downloads, according to the available data) and Abstracts Views on Vision4Press platform.
Data correspond to usage on the plateform after 2015. The current usage metrics is available 48-96 hours after online publication and is updated daily on week days.
Initial download of the metrics may take a while.