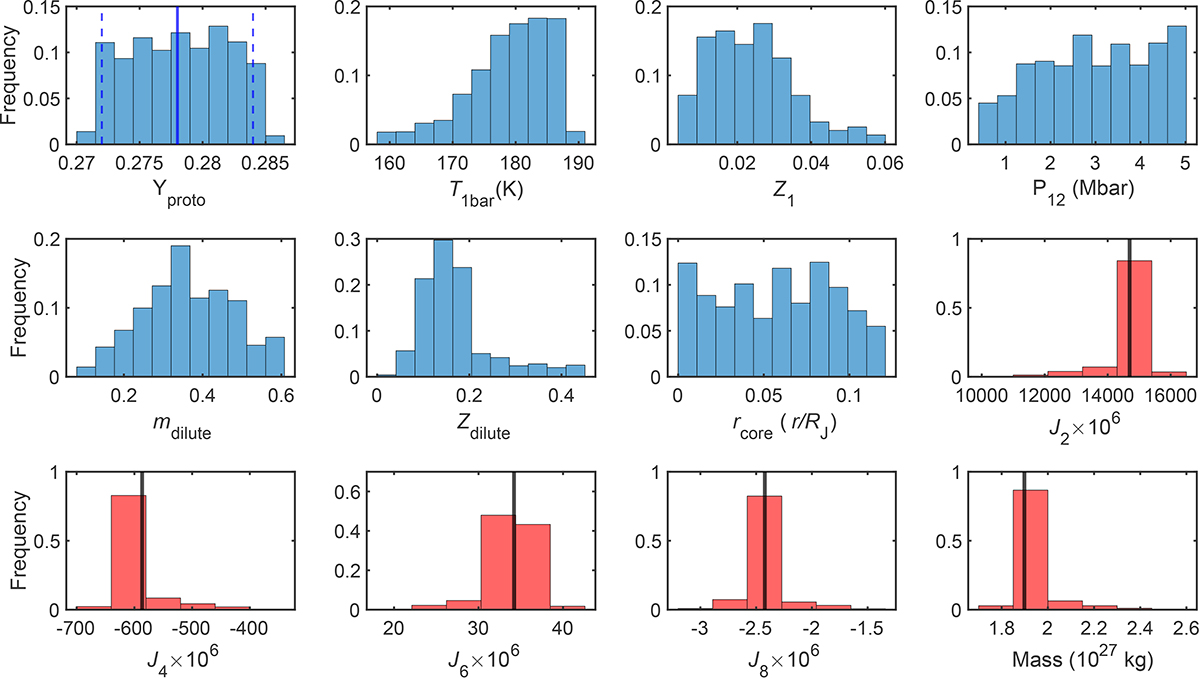
Fig. B.1.
Download original image
Distribution of the inputs (blue) and the outputs (red) in the training dataset. For Yproto the solid blue line is the determined value and the dashed blue lines represent the uncertainty (Serenelli & Basu 2010). The solid black lines are Juno-derived values (Durante et al. 2020). We note that some of the histogram bins for the outputs are not visible due to the high frequency of the proximate to Juno models. We refer readers to Table B.1 and the x-axis range for the full range of the dataset.
Current usage metrics show cumulative count of Article Views (full-text article views including HTML views, PDF and ePub downloads, according to the available data) and Abstracts Views on Vision4Press platform.
Data correspond to usage on the plateform after 2015. The current usage metrics is available 48-96 hours after online publication and is updated daily on week days.
Initial download of the metrics may take a while.