Fig. 4.
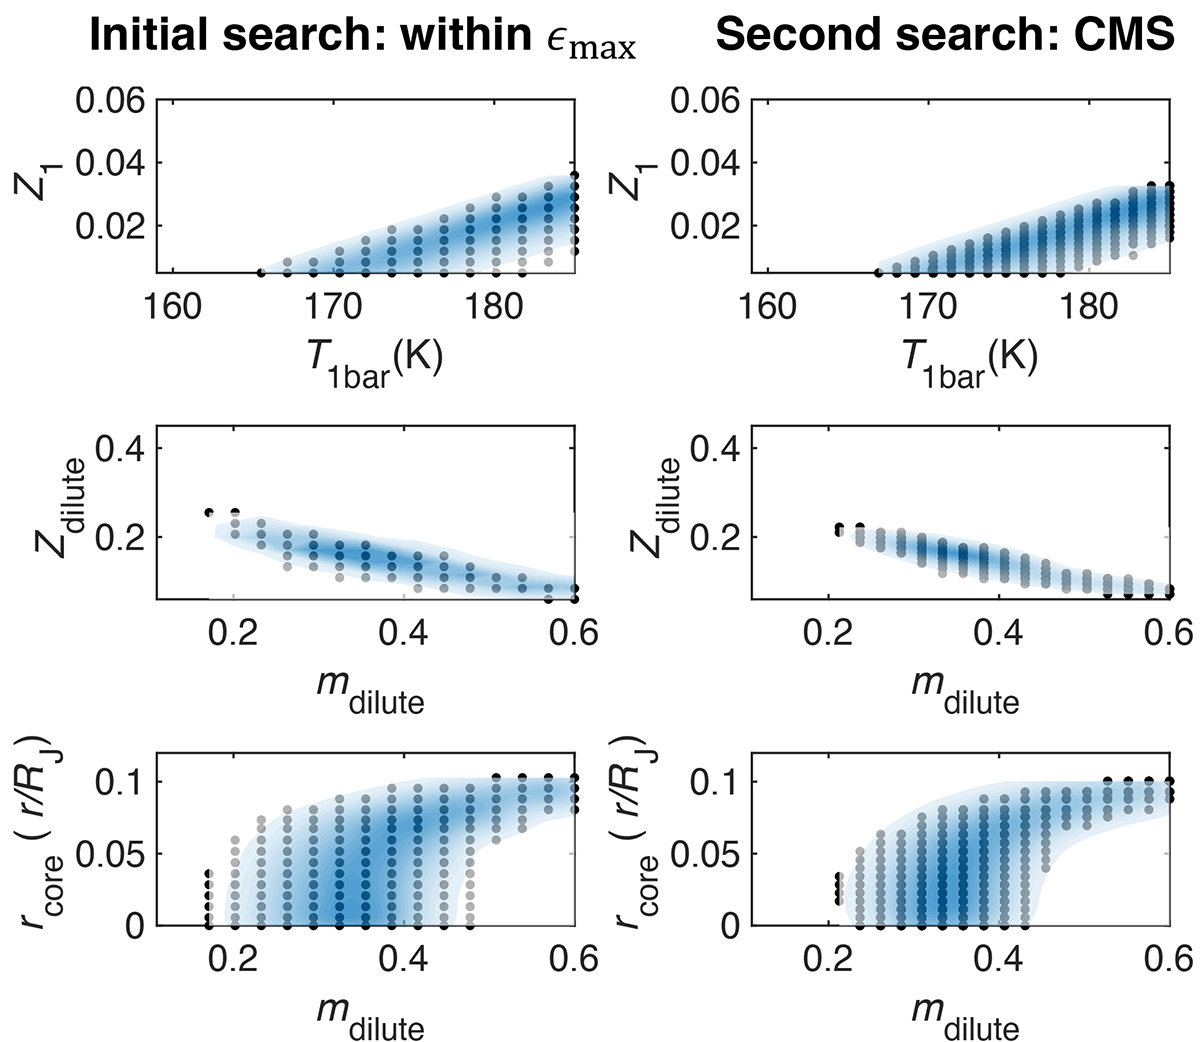
Download original image
Correlation between interior features for the two grid search stages. The black points are model results, and the blue shading is the models’ distribution. The left column shows accepted models predicted by NeuralCMS in the first grid search, within the DNN’s maximal absolute prediction errors on the validation dataset. In the right column are accepted models computed with CMS found in the second tighter grid search. The axes range is the initial wide search range. The range of P12 and Yproto was not reduced. The middle panels nicely reproduce previous results (Howard et al. 2023a).
Current usage metrics show cumulative count of Article Views (full-text article views including HTML views, PDF and ePub downloads, according to the available data) and Abstracts Views on Vision4Press platform.
Data correspond to usage on the plateform after 2015. The current usage metrics is available 48-96 hours after online publication and is updated daily on week days.
Initial download of the metrics may take a while.