Fig. 3.
Download original image
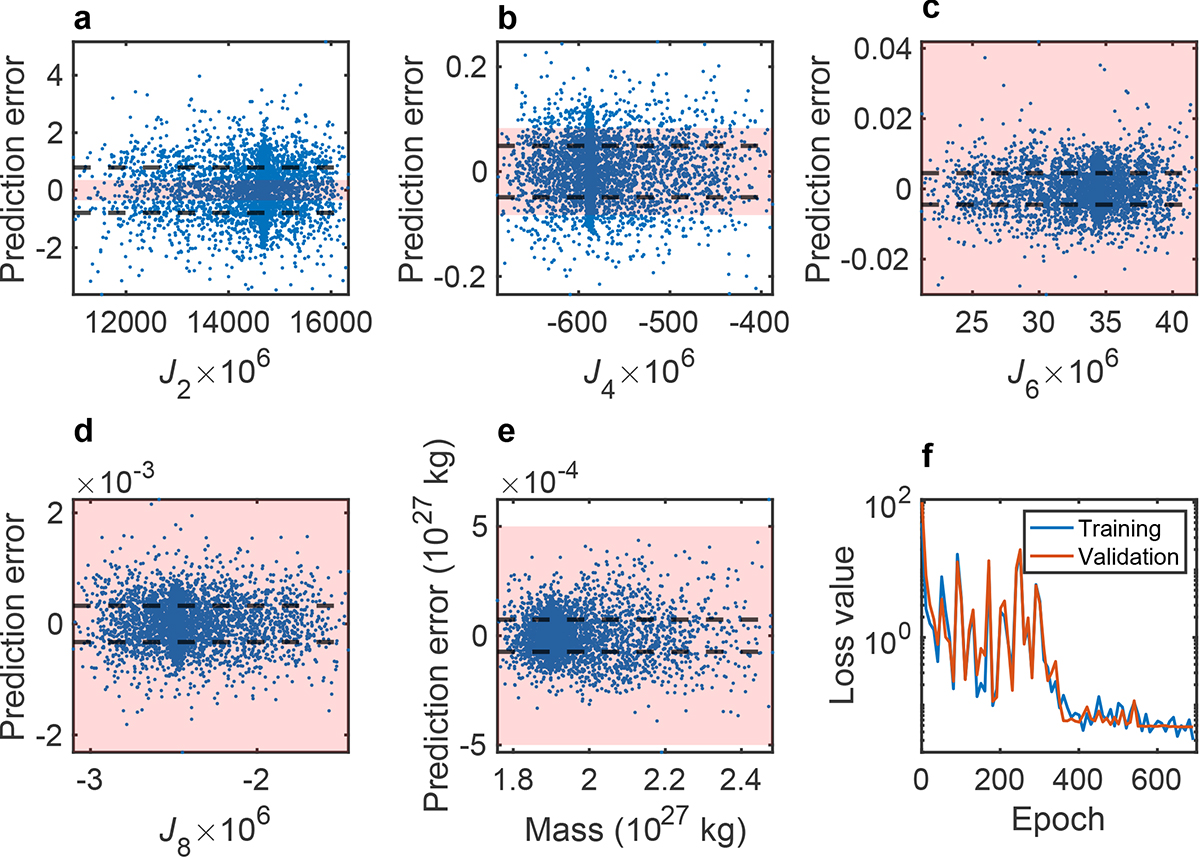
Performance of NeuralCMS on a sample of 104 models from the validation dataset (a–e). The dashed black lines are the standard deviation of the full validation dataset error ϵσ. The red patch represents the combined uncertainty from dynamics (Miguel et al. 2022) and measurement errors (Durante et al. 2020) for the gravity harmonics: ![]() . The mass uncertainty is due to various G values. The learning curve of the DNN at every ten epochs using Eq. (1) (f).
. The mass uncertainty is due to various G values. The learning curve of the DNN at every ten epochs using Eq. (1) (f).
Current usage metrics show cumulative count of Article Views (full-text article views including HTML views, PDF and ePub downloads, according to the available data) and Abstracts Views on Vision4Press platform.
Data correspond to usage on the plateform after 2015. The current usage metrics is available 48-96 hours after online publication and is updated daily on week days.
Initial download of the metrics may take a while.