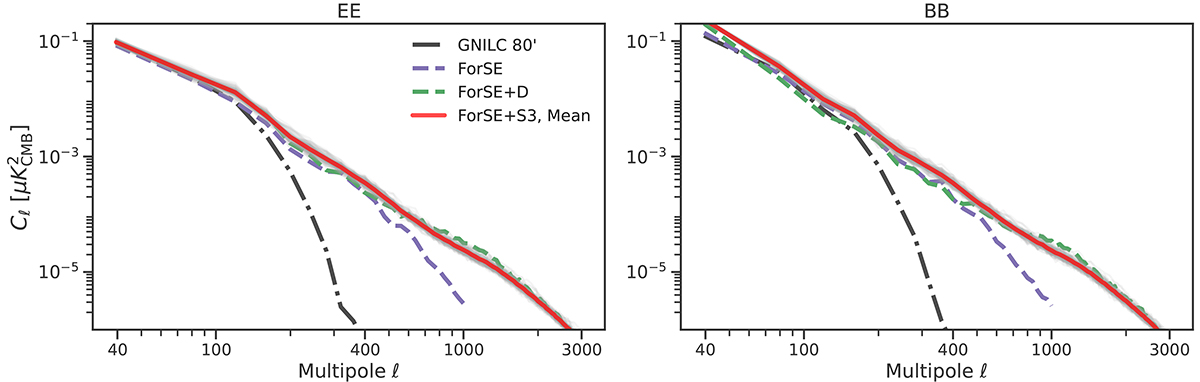
Fig. 9.
Download original image
EE and BB power spectra of the squared patches at 3′ shown in Fig. 8. Dash-dotted black lines are the power spectra for GNILC 80′ patches and purple lines are for the deterministic 12′ patches. Green lines depict the behavior of FORSE+D maps, while gray lines show the power spectra of all the 100 realizations from FORSE+S3 and red lines are the means.
Current usage metrics show cumulative count of Article Views (full-text article views including HTML views, PDF and ePub downloads, according to the available data) and Abstracts Views on Vision4Press platform.
Data correspond to usage on the plateform after 2015. The current usage metrics is available 48-96 hours after online publication and is updated daily on week days.
Initial download of the metrics may take a while.