Open Access
Fig. 3.
Download original image
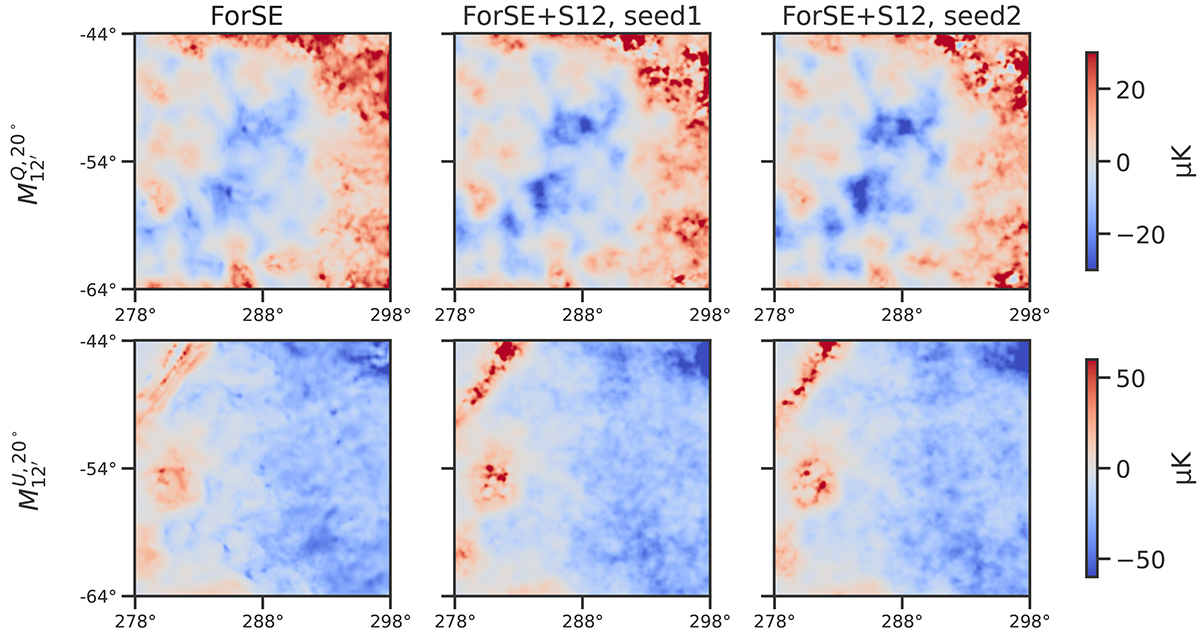
Maps of 20° ×20° patches at 12′. From left to right are the deterministic map from FORSE and two stochastic realizations from FORSE+S12. Throughout this paper, all the maps are shown in Galactic coordinates.
Current usage metrics show cumulative count of Article Views (full-text article views including HTML views, PDF and ePub downloads, according to the available data) and Abstracts Views on Vision4Press platform.
Data correspond to usage on the plateform after 2015. The current usage metrics is available 48-96 hours after online publication and is updated daily on week days.
Initial download of the metrics may take a while.