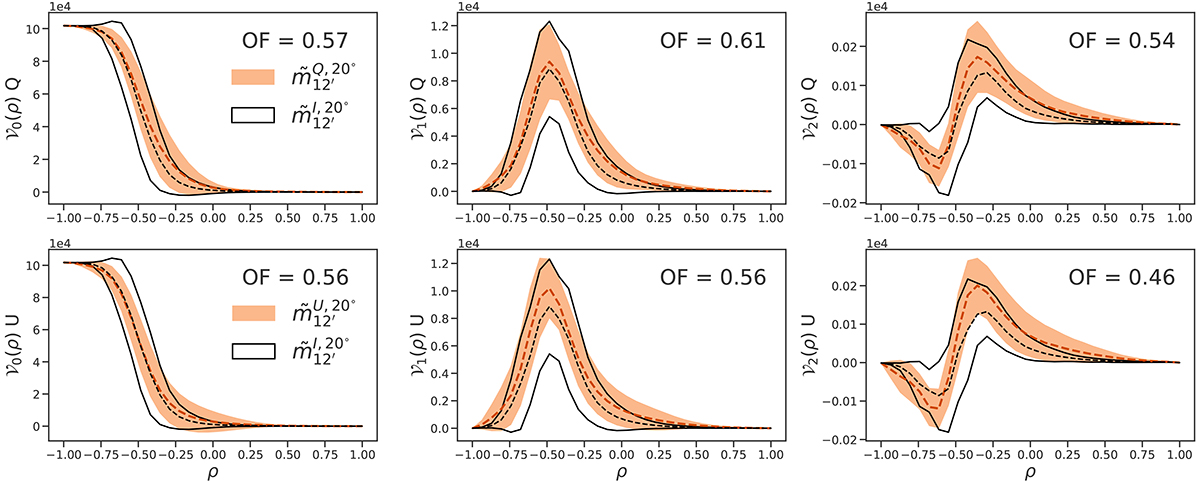
Fig. 2.
Download original image
MFs of small scales at 12′ produced by FORSE+S, compared with the ones from the intensity maps in the training set. The overlapping fractions (OFs) of each pair of MFs are also shown. The dashed line represents the mean over the set of different patches and the shaded area is their standard deviation. The distribution of Q maps is shown in the upper panel, and U in the lower panel.
Current usage metrics show cumulative count of Article Views (full-text article views including HTML views, PDF and ePub downloads, according to the available data) and Abstracts Views on Vision4Press platform.
Data correspond to usage on the plateform after 2015. The current usage metrics is available 48-96 hours after online publication and is updated daily on week days.
Initial download of the metrics may take a while.