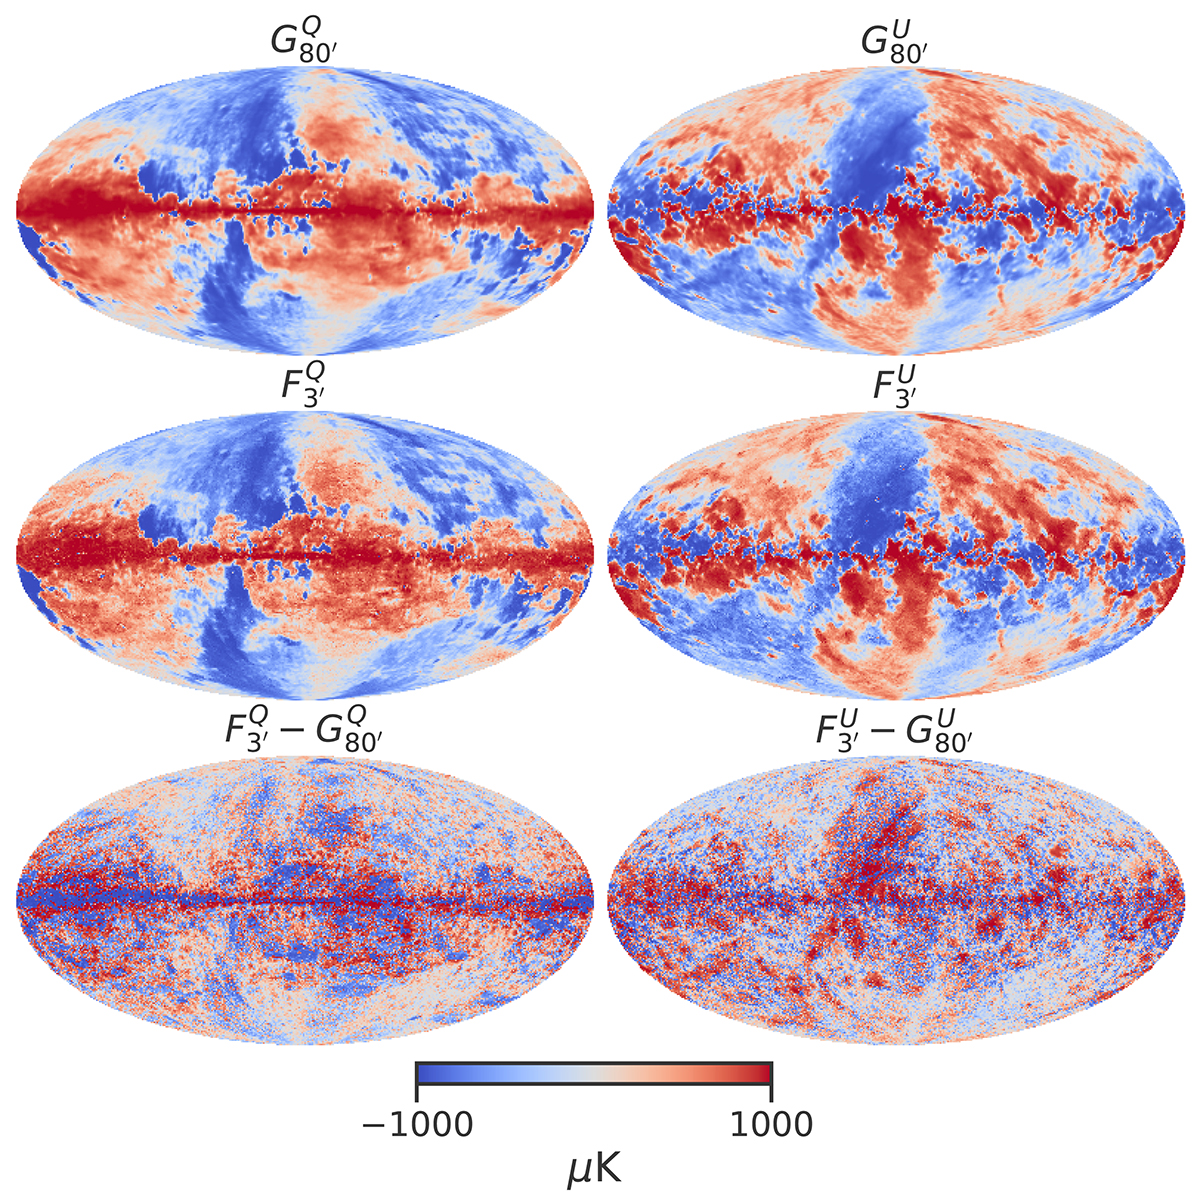
Fig. 12.
Download original image
Top panel: full-sky polarization maps (left: Stokes Q, right: Stokes U) for the GNILC template at a 80′ angular resolution. These maps are the input to our algorithm. Middle panel: maps with small-scale features, up to 3′, generated by FORSE+D. Bottom panel: the difference between the two maps. The residuals mostly encode smaller angular scales, as was expected.
Current usage metrics show cumulative count of Article Views (full-text article views including HTML views, PDF and ePub downloads, according to the available data) and Abstracts Views on Vision4Press platform.
Data correspond to usage on the plateform after 2015. The current usage metrics is available 48-96 hours after online publication and is updated daily on week days.
Initial download of the metrics may take a while.