Open Access
Fig. 7
Download original image
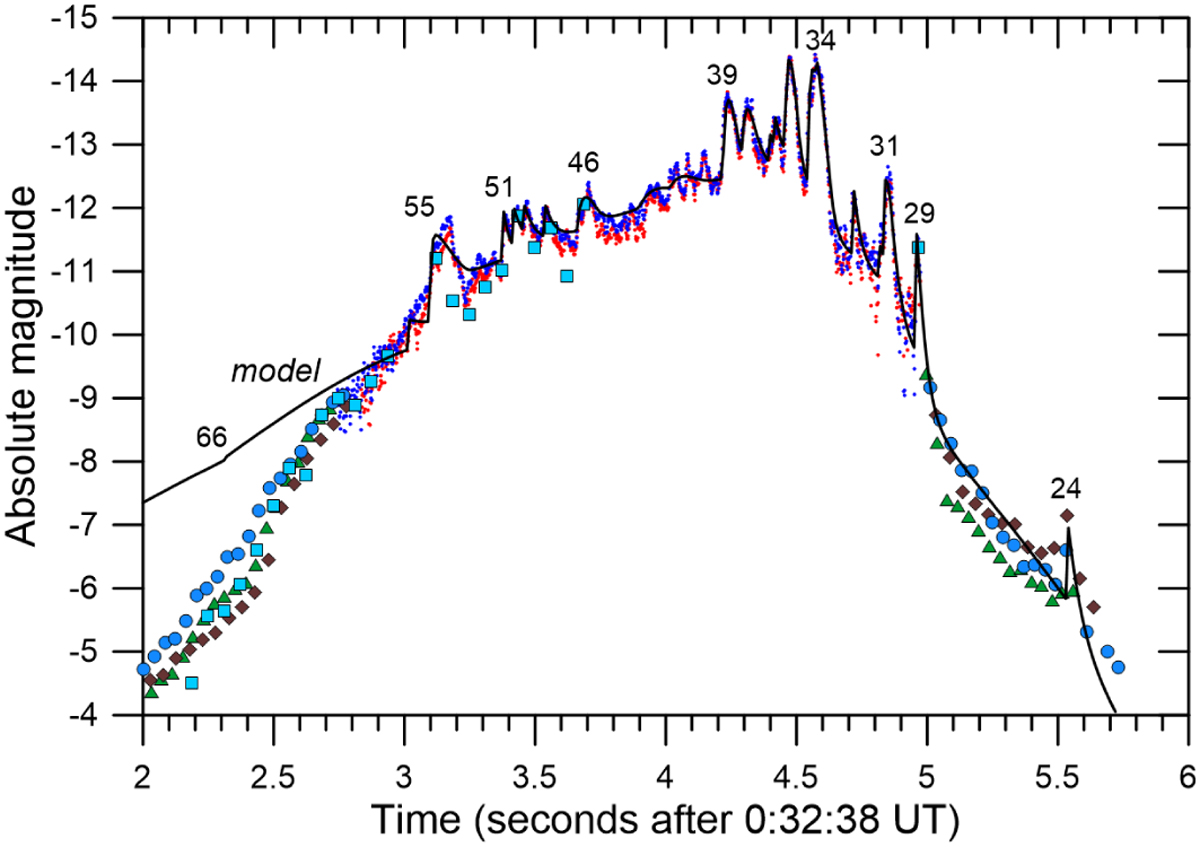
Observed (symbols) and modeled (solid line) light curve as a function of time. The symbols are the same as in Fig. 5. The numbers give the approximate heights in kilometers of selected light-curve features.
Current usage metrics show cumulative count of Article Views (full-text article views including HTML views, PDF and ePub downloads, according to the available data) and Abstracts Views on Vision4Press platform.
Data correspond to usage on the plateform after 2015. The current usage metrics is available 48-96 hours after online publication and is updated daily on week days.
Initial download of the metrics may take a while.