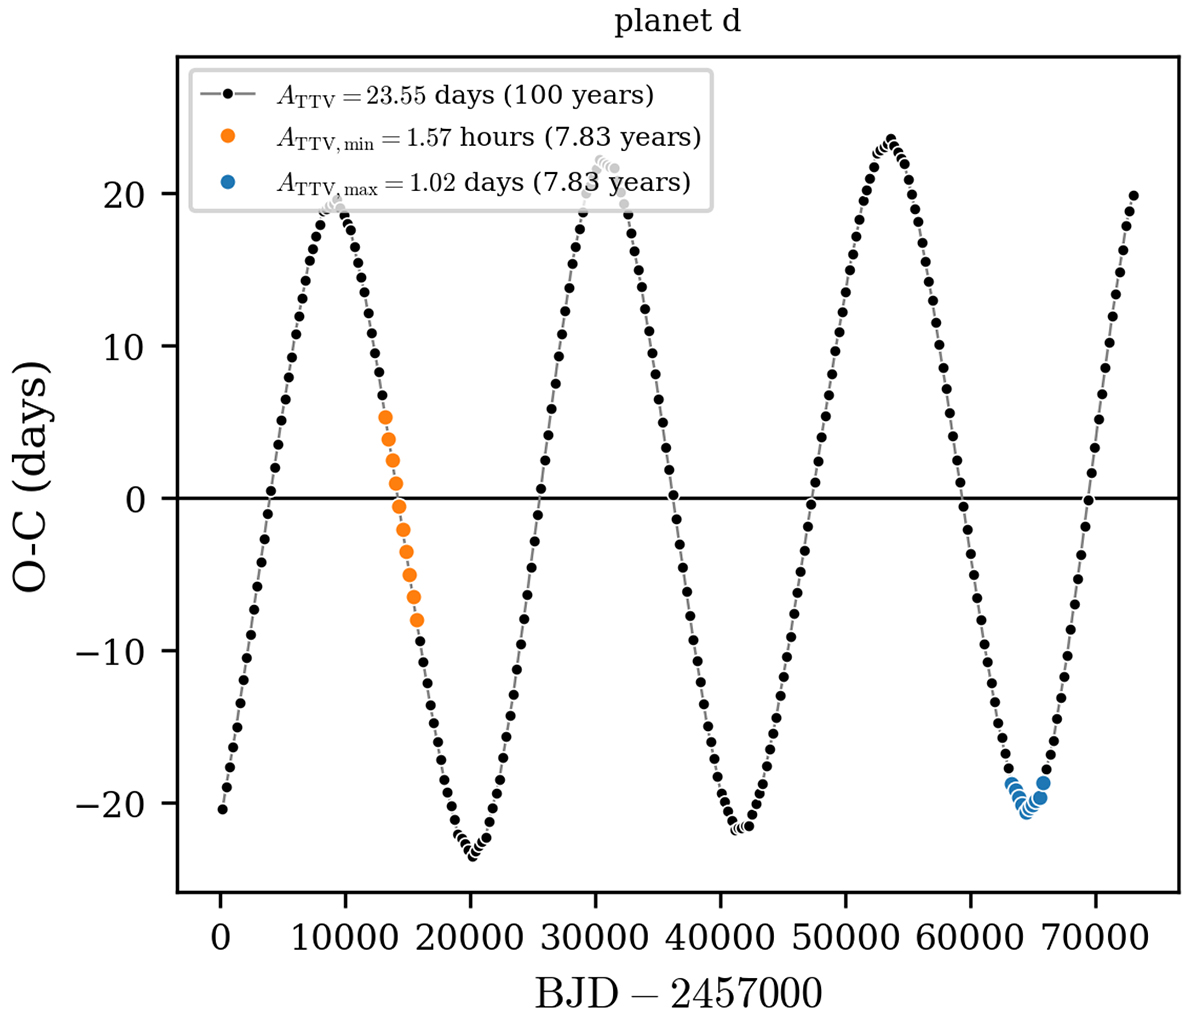
Fig. 3.
Download original image
O − C diagram of synthetic transit times (T0, s) of 100 yr (black circles) of dynamical simulations with TRADES computed using the Santerne et al. (2019) solution and including all planets. Highlighted are the two observing windows of ∼7.8 yr whose re-computed O − C (as described in Sect. 3.1) show the minimum (orange) TTV amplitude (ATTV, min = 1.57 h) and the maximum (blue) TTV amplitude (ATTV, max = 1.02 days).
Current usage metrics show cumulative count of Article Views (full-text article views including HTML views, PDF and ePub downloads, according to the available data) and Abstracts Views on Vision4Press platform.
Data correspond to usage on the plateform after 2015. The current usage metrics is available 48-96 hours after online publication and is updated daily on week days.
Initial download of the metrics may take a while.