Fig. 2.
Download original image
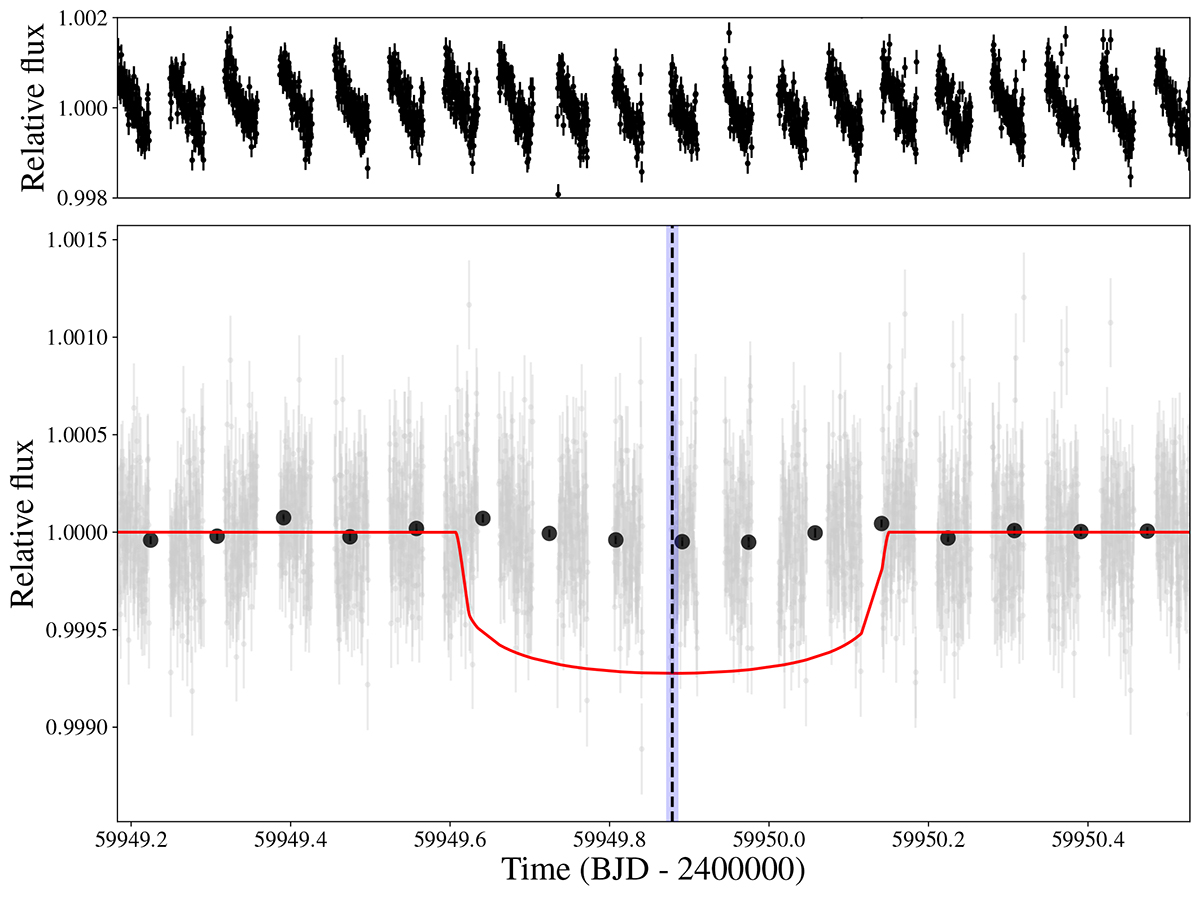
CHEOPS observations of HIP 41378 at the predicted time of planet d’s transit. Top: Raw light curve. Bottom: Detrended (gray) and 2-h-binned light curves (black). The transit model is in red. The dotted vertical line indicates the predicted time of mid-transit T0, d, assuming an orbital period of Pd = 278.36 d. The shaded blue region represents the uncertainties on T0, d.
Current usage metrics show cumulative count of Article Views (full-text article views including HTML views, PDF and ePub downloads, according to the available data) and Abstracts Views on Vision4Press platform.
Data correspond to usage on the plateform after 2015. The current usage metrics is available 48-96 hours after online publication and is updated daily on week days.
Initial download of the metrics may take a while.