Open Access
Fig. 9.
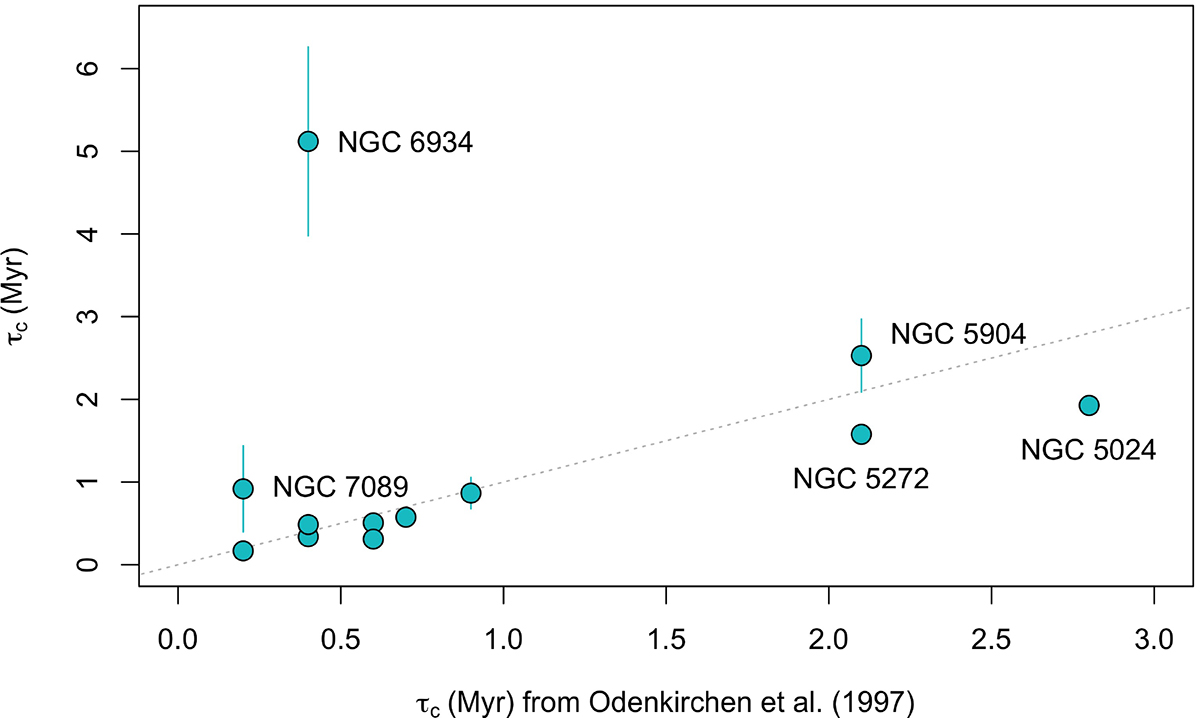
Download original image
Comparison between our τc estimates and those by Odenkirchen et al. (1997) for 12 GCs in common. Perfect agreement is marked by a dotted line. Errorbars are plotted for each GC, but are mostly smaller than the points. The GCs for which τc has changed are labeled.
Current usage metrics show cumulative count of Article Views (full-text article views including HTML views, PDF and ePub downloads, according to the available data) and Abstracts Views on Vision4Press platform.
Data correspond to usage on the plateform after 2015. The current usage metrics is available 48-96 hours after online publication and is updated daily on week days.
Initial download of the metrics may take a while.