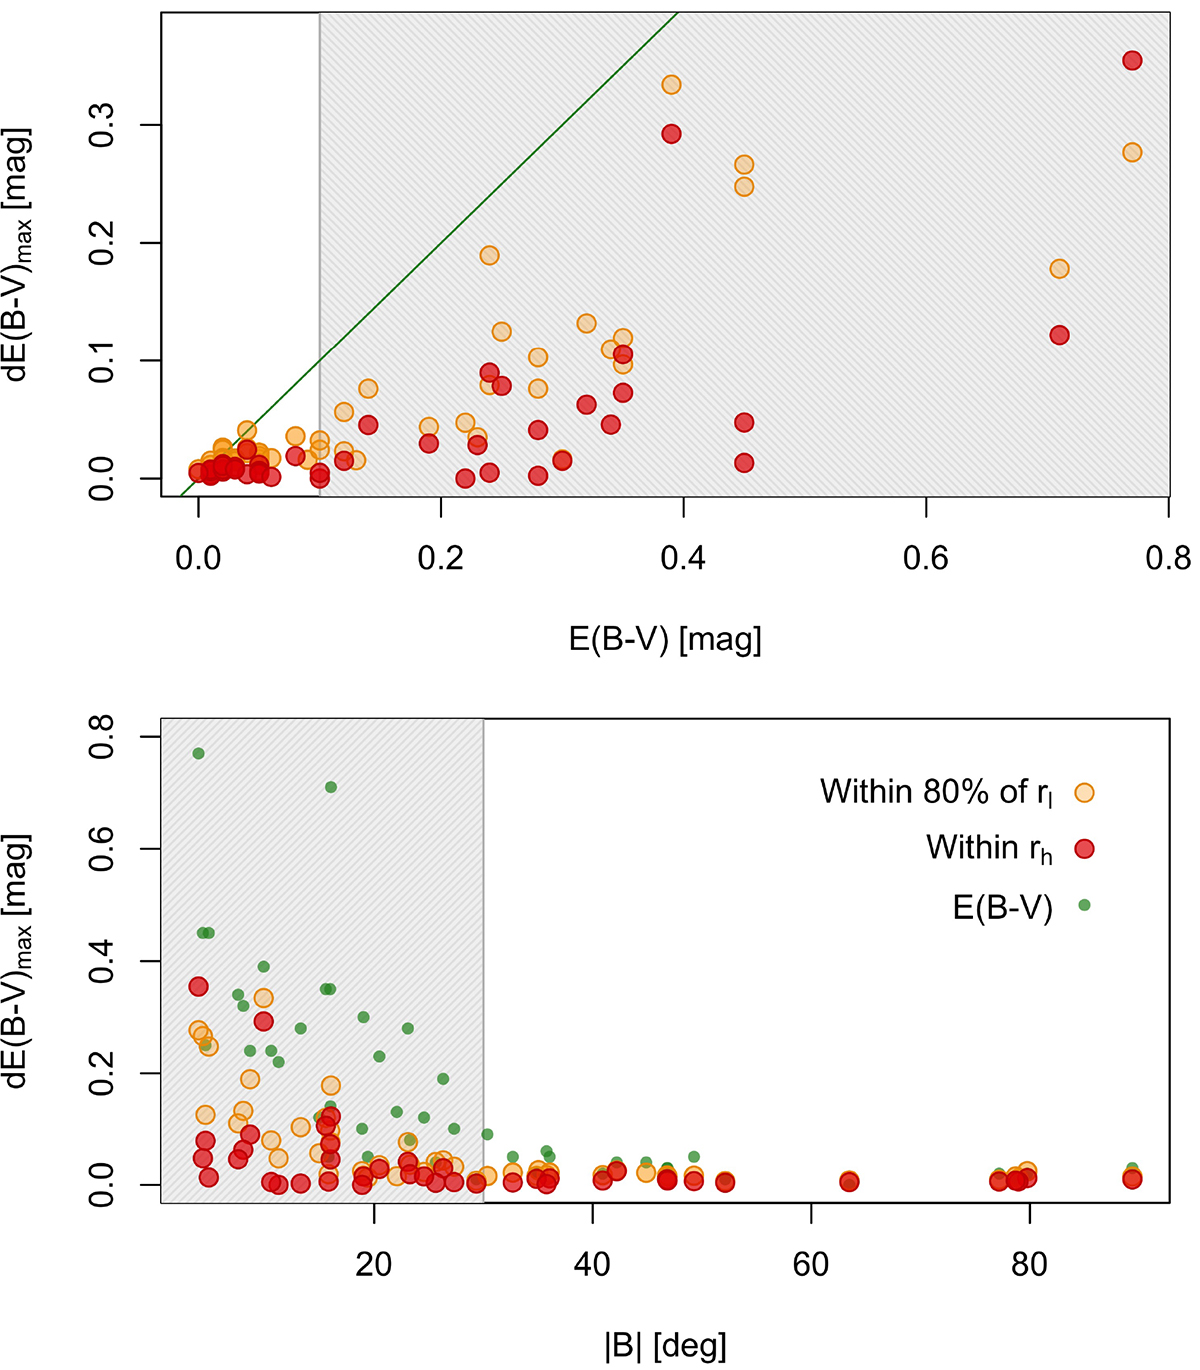
Fig. 7.
Download original image
Behavior of the total DR, dE(B − V)max, with E(B − V) (top panel) and Galactic latitude (bottom panel). In each panel, orange symbols are the total DR computed within 80% of rℓ, red ones within rh. The green line in the top panel is the 1:1 agreement, while the green dots in the bottom panel are the E(B − V) values of the sampled GCs. The gray-shaded areas cover the high-reddening sample (Sect. 4.2).
Current usage metrics show cumulative count of Article Views (full-text article views including HTML views, PDF and ePub downloads, according to the available data) and Abstracts Views on Vision4Press platform.
Data correspond to usage on the plateform after 2015. The current usage metrics is available 48-96 hours after online publication and is updated daily on week days.
Initial download of the metrics may take a while.