Open Access
Fig. 5.
Download original image
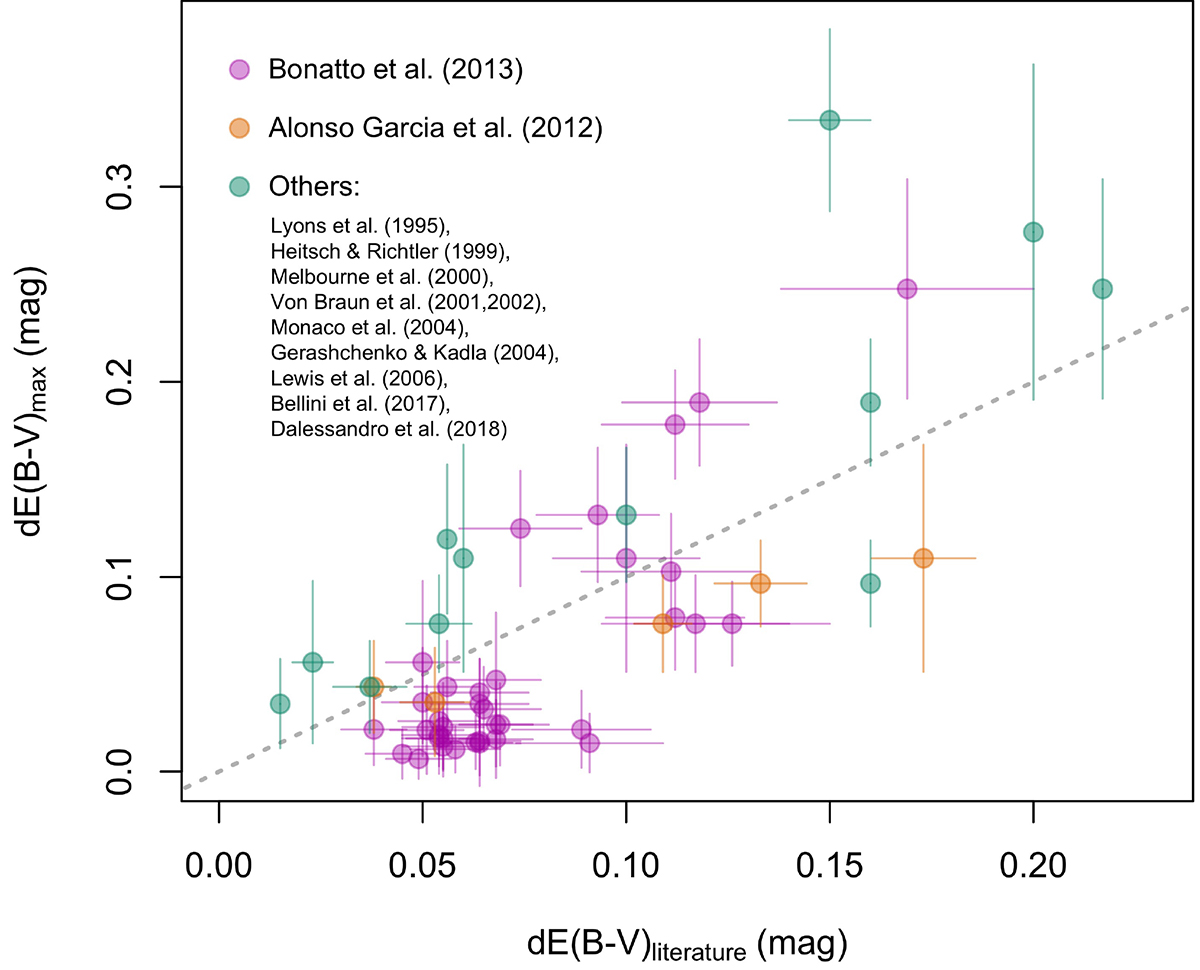
Comparison of the total reddening variations, dE(B − V)max, found here and in the literature collection. Different colors refer to different sources, as labeled. The 1:1 relation is indicated as a dotted gray line. See Sect. 3.3 for more details.
Current usage metrics show cumulative count of Article Views (full-text article views including HTML views, PDF and ePub downloads, according to the available data) and Abstracts Views on Vision4Press platform.
Data correspond to usage on the plateform after 2015. The current usage metrics is available 48-96 hours after online publication and is updated daily on week days.
Initial download of the metrics may take a while.