Fig. 3.
Download original image
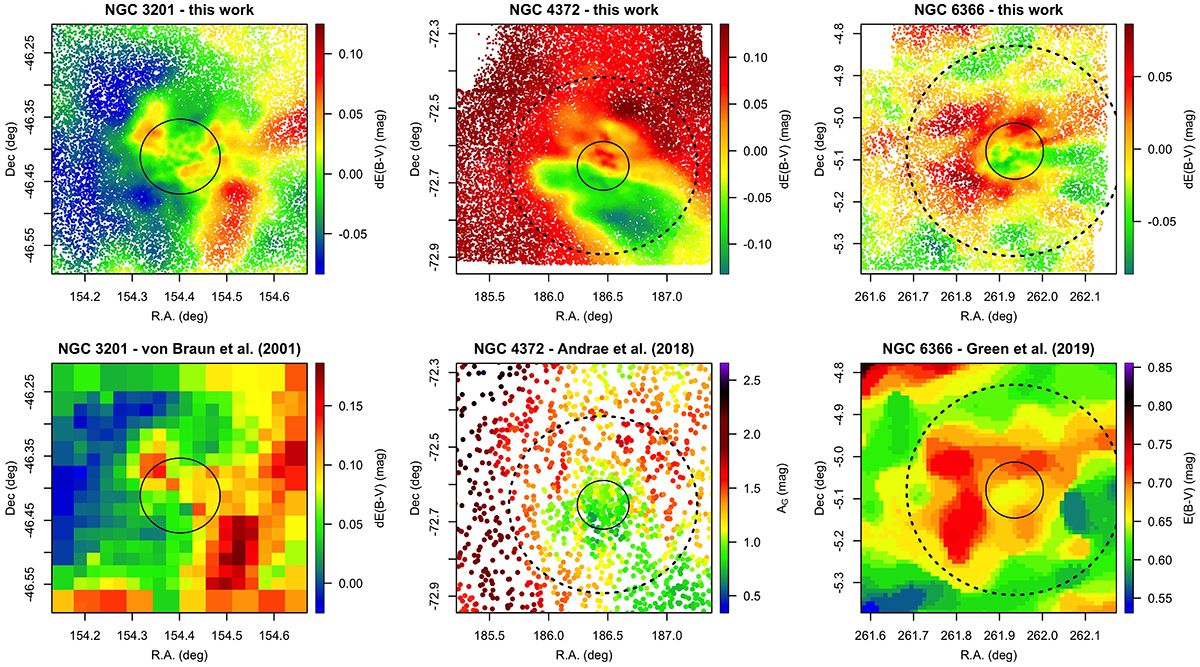
Comparison of our DR maps (top row) with literature ones (bottom row) for three well-studied GCs, as annotated. The left panels show NGC 3201, compared with the optical map obtained with a method similar to ours (von Braun & Mateo 2001). The center panels show NGC 4372 compared with the Gaia DR2 AG values for stars brigther than G ≃ 17 mag (Andrae et al. 2018). The right panels show NGC 6366 compared with the 3D reddening maps obtained from Pan-STARSS, 2MASS, and Gaia data (Green et al. 2019). The coordinate and color scales are tailored to match the different literature sources. In all panels, the solid circle represents rh and the dashed circle – when visible – rℓ.
Current usage metrics show cumulative count of Article Views (full-text article views including HTML views, PDF and ePub downloads, according to the available data) and Abstracts Views on Vision4Press platform.
Data correspond to usage on the plateform after 2015. The current usage metrics is available 48-96 hours after online publication and is updated daily on week days.
Initial download of the metrics may take a while.