Fig. 2.
Download original image
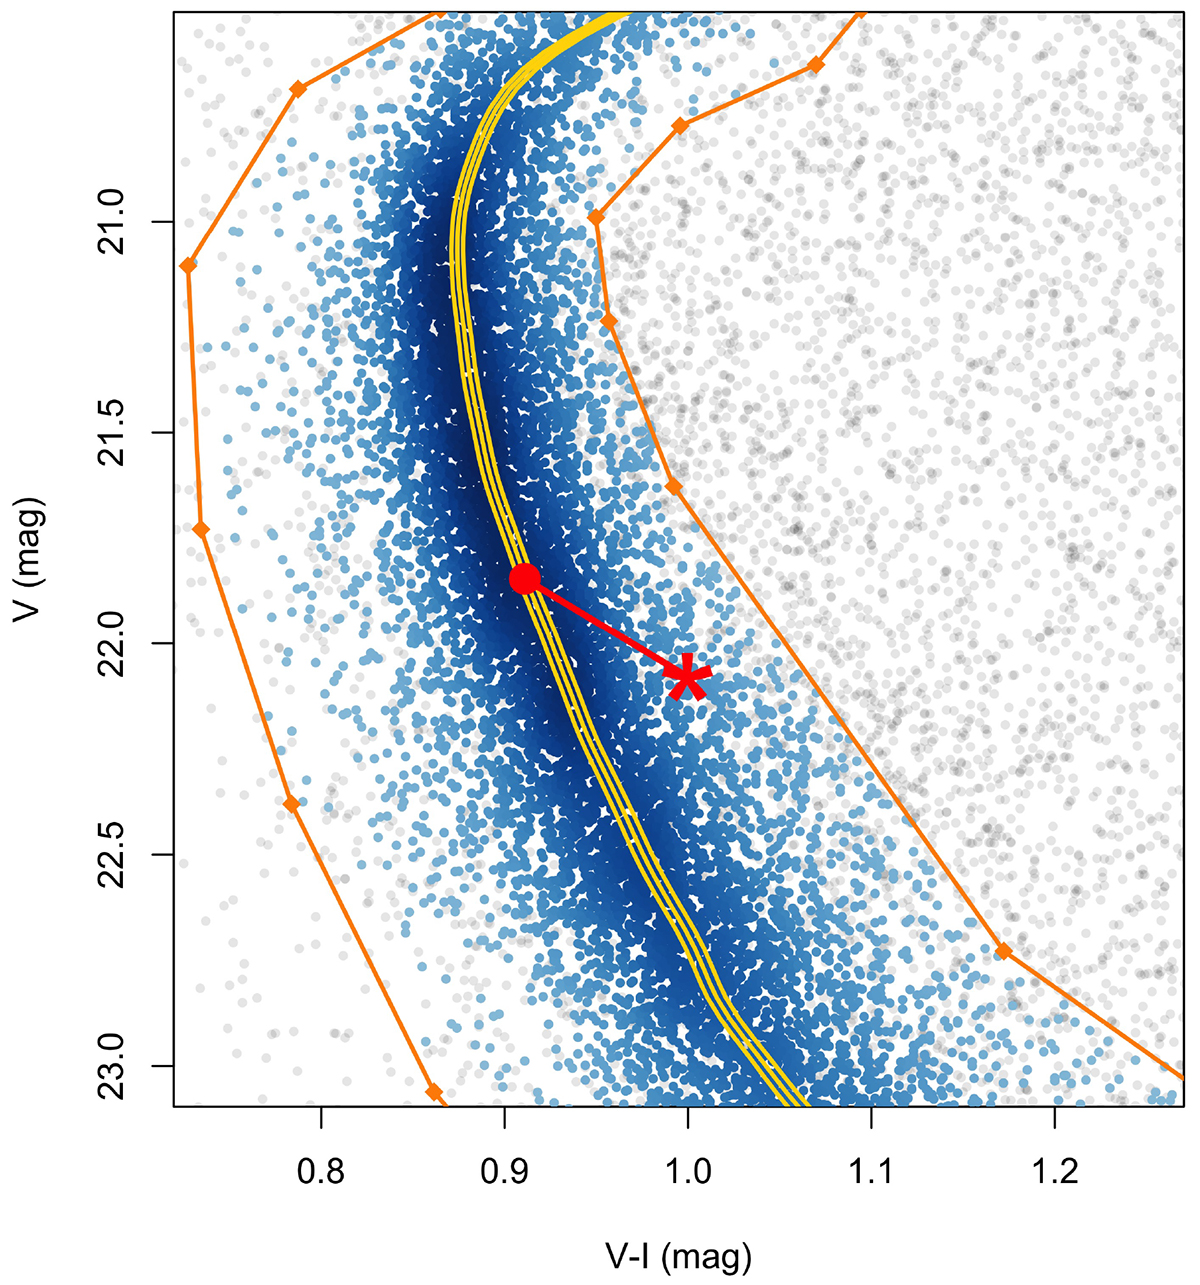
Illustration of the DR method, using the case of IC 4499 in the (V, V − I) CMD plane as an example. Gray dots show the full reference photometric catalog. The manual preselection box is plotted in orange. The sample of stars belonging simultaneously to the four boxes in the (V, B − V), (V, V − I), (V, B − I), and (B − V, V − I) planes is plotted in blue. The median ridge line (MRL) is plotted as a yellow curve, bracketed by its uncertainty curves. The color displacement ΔE(V − I), is computed for each star (red star symbol) along the reddening line (red line), which intersects the MS on the red dot. This is the position that the star would have on the MRL if no reddening or photometric errors were present.
Current usage metrics show cumulative count of Article Views (full-text article views including HTML views, PDF and ePub downloads, according to the available data) and Abstracts Views on Vision4Press platform.
Data correspond to usage on the plateform after 2015. The current usage metrics is available 48-96 hours after online publication and is updated daily on week days.
Initial download of the metrics may take a while.