Fig. 10.
Download original image
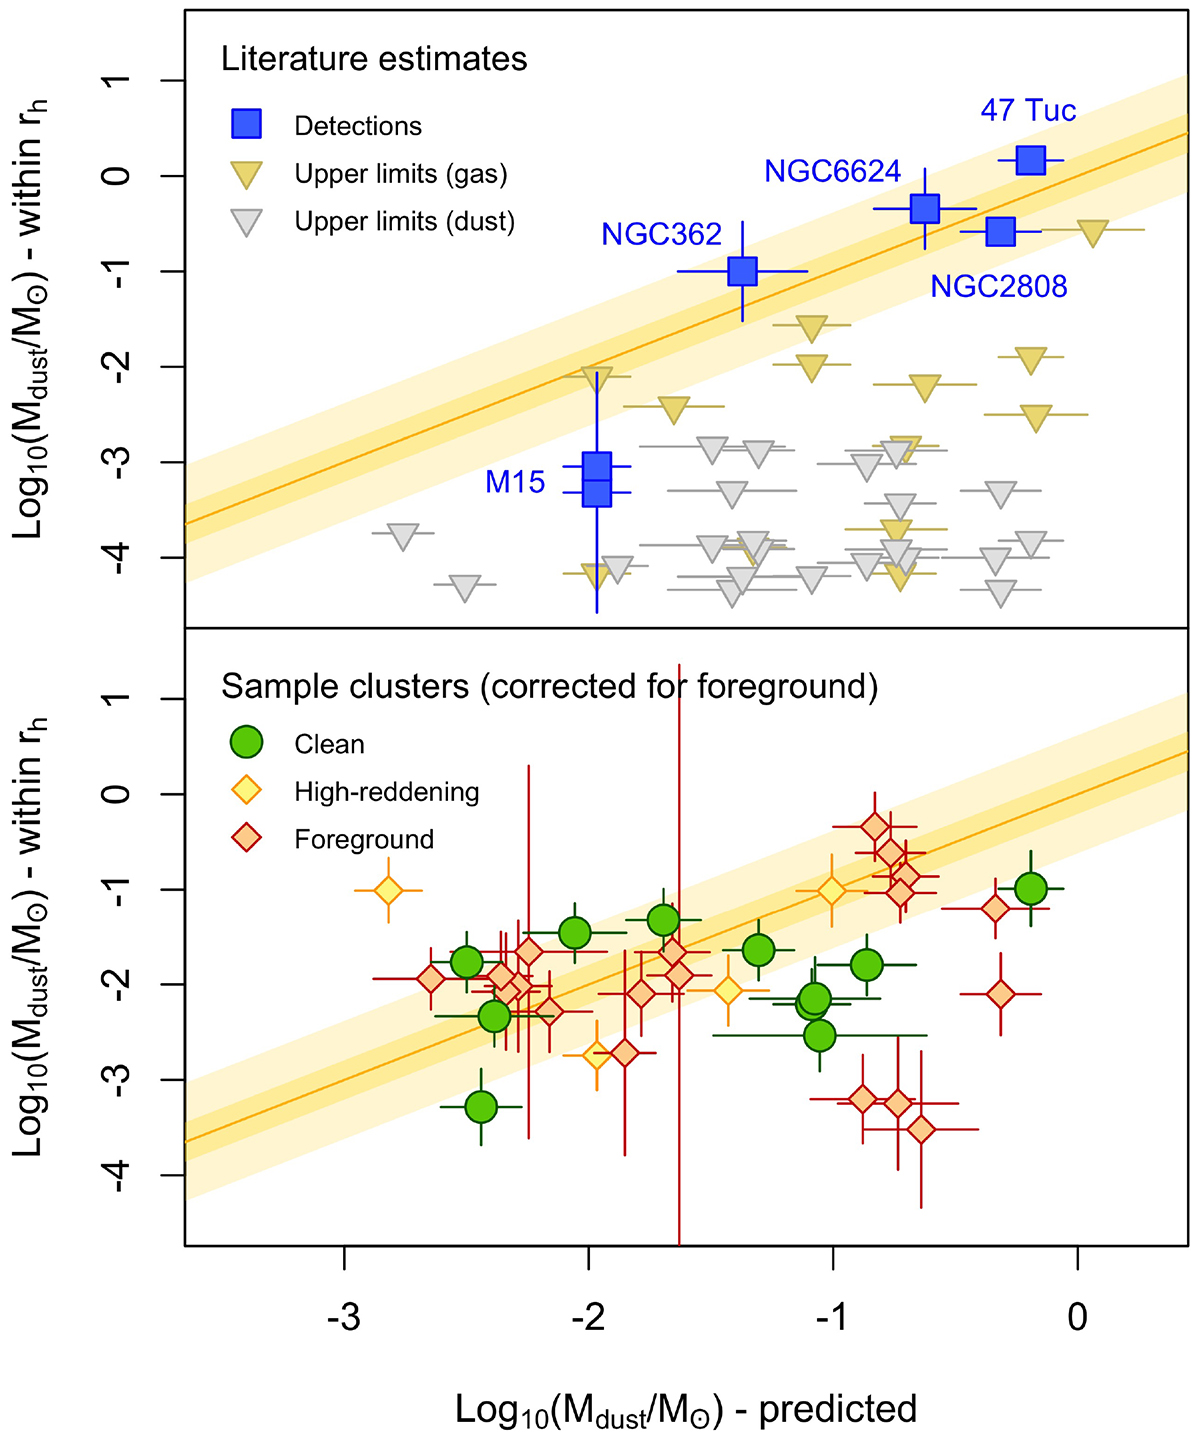
Top panel: comparison between the literature upper limits (triangles) and detections of dust in GCs (squares, see Table 3) with the theoretical expectations from Table 1. Perfect agreement is marked by the orange line, where 1 and 3σ uncertainties are shaded in yellow and dark yellow, respectively. Bottom panel: our dust estimates for the Stetson et al. (2019) GCs are compared with the same theoretical predictions. The clean GCs are plotted in green, the high-reddening ones in yellow, the contaminated in red (see Sect. 3). All estimates were corrected for foreground contamination using 3D cumulative reddening maps (Lallement et al. 2022). 1 σ uncertainties are plotted in all panels.
Current usage metrics show cumulative count of Article Views (full-text article views including HTML views, PDF and ePub downloads, according to the available data) and Abstracts Views on Vision4Press platform.
Data correspond to usage on the plateform after 2015. The current usage metrics is available 48-96 hours after online publication and is updated daily on week days.
Initial download of the metrics may take a while.