Open Access
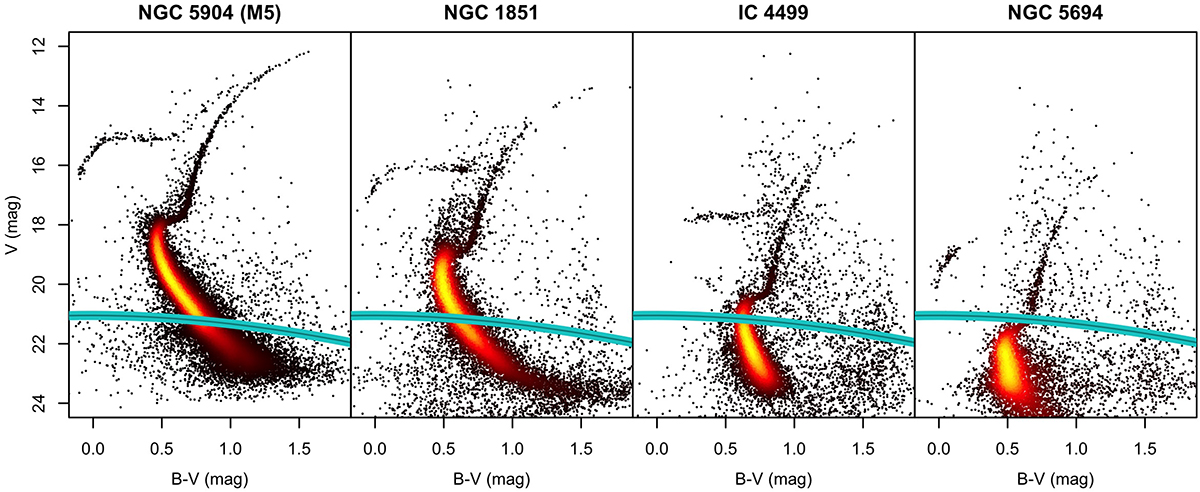
Fig. 1.
Download original image
Examples of color-magnitude diagrams from Stetson et al. (2019), for GCs at different distances. The Gaia limiting magnitude (G ≃ 21 mag) is plotted in all panels as a dark cyan line, with its uncertainty interval in cyan, based on the color transformations by Pancino et al. (2022).
Current usage metrics show cumulative count of Article Views (full-text article views including HTML views, PDF and ePub downloads, according to the available data) and Abstracts Views on Vision4Press platform.
Data correspond to usage on the plateform after 2015. The current usage metrics is available 48-96 hours after online publication and is updated daily on week days.
Initial download of the metrics may take a while.