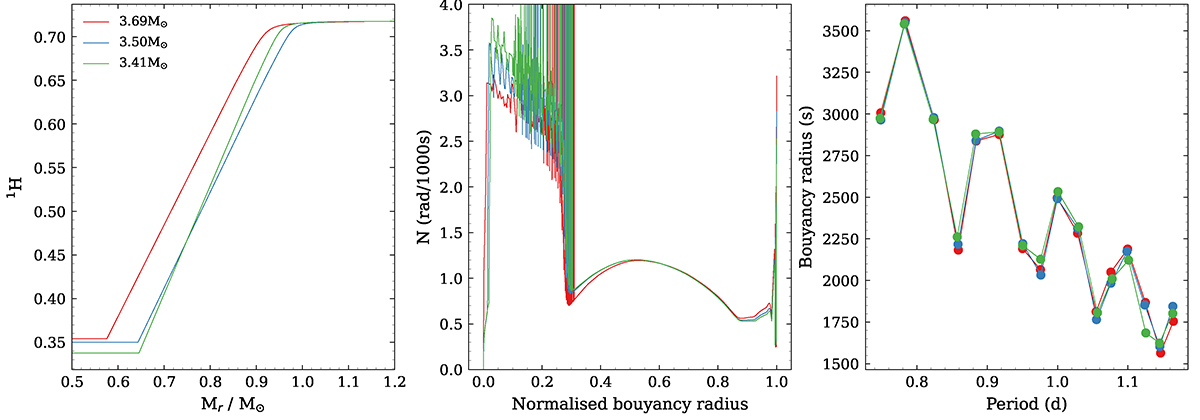
Fig. H.1.
Download original image
Example of degeneracy: three different stellar structure models with similar period spacing patterns. All three models have the same values for the metallicity Z, Xs and mode classification. They were constructed by setting the values of Mμ and Hslope and allowing the values of mass M, Xc, Ω/Ωcrit and curvature α to vary. The red, blue and green models correspond to Mμ = 0.25, 0.25, and 0.28 and Hslope = 3.8, 3.8, and 4.2, respectively. These changes are reflected in the left panel. Left panel: Hydrogen abundance profile as a function of mass coordinate for each model. Middle panel: Brunt-Väisälä profile as a function of normalised buoyancy radius. Right panel: Period spacing patterns.
Current usage metrics show cumulative count of Article Views (full-text article views including HTML views, PDF and ePub downloads, according to the available data) and Abstracts Views on Vision4Press platform.
Data correspond to usage on the plateform after 2015. The current usage metrics is available 48-96 hours after online publication and is updated daily on week days.
Initial download of the metrics may take a while.